Hi visualization-experts!
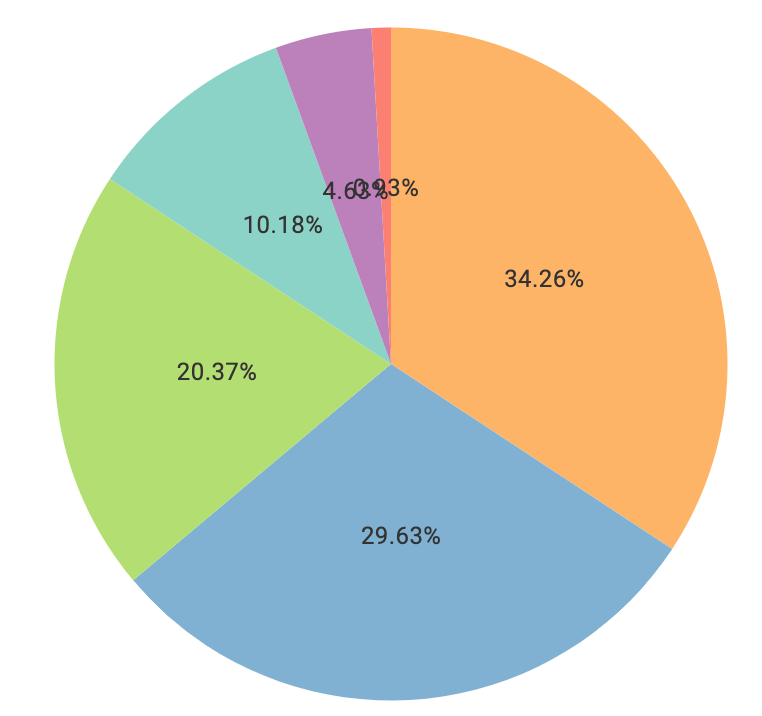
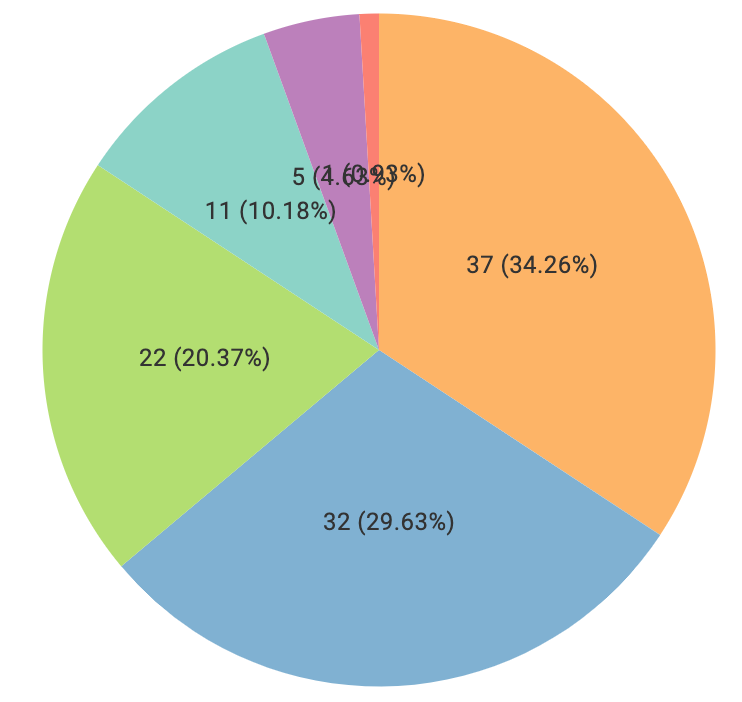
I am wondering if it is possible to change the size and position of the values displayed in the pie chart. I noticed that I can decide whether the text should be displayed outside or inside the chart, but I can’t see any options for the size or position in general. The reason for my question is that sometimes the text overlaps, making it unreadable (examples below).
Thanks in advance!
Cheers,
Rebecca
Hey @rebeccasjoeblom,
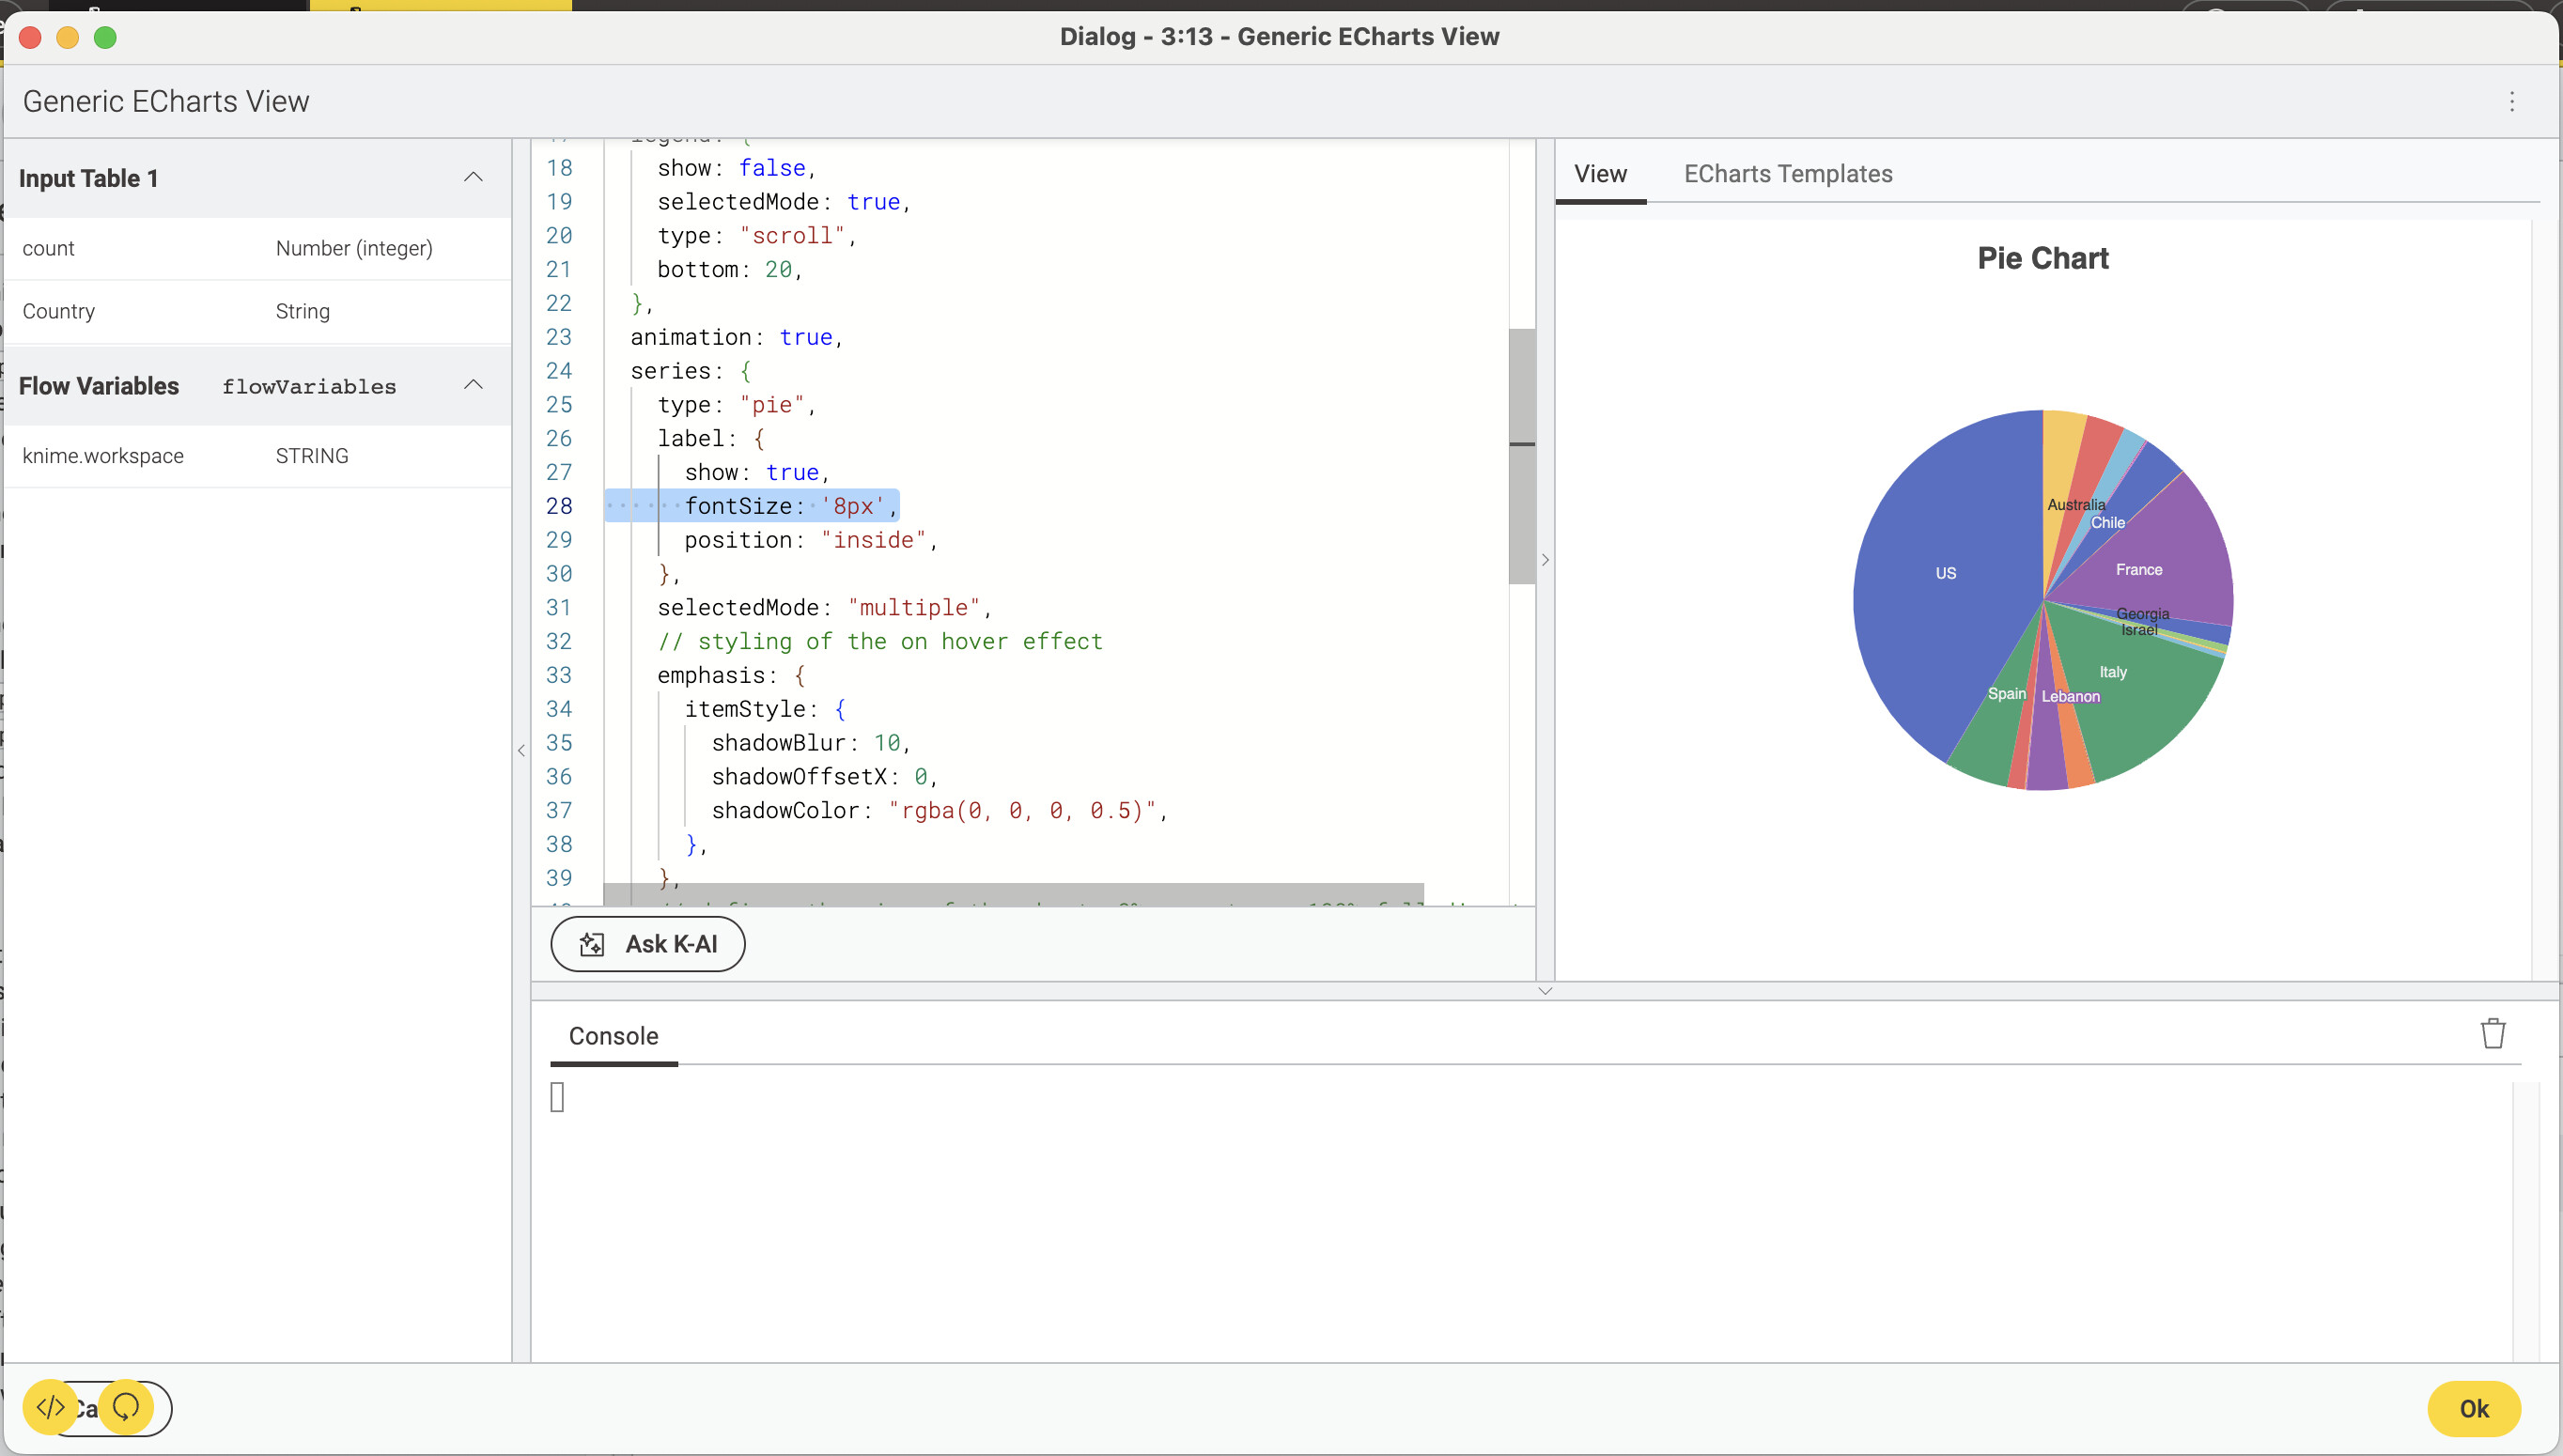
this is currently not possible with the native node, but we recently released the “Generic ECharts” node. With this node you can customise every part of the chart. You can even make use of the AI to help you create the desired result.
Customising our native nodes further is still something we have to implement.
Greetings,
Daniel
2 Likes
Hi @DanielBog,
Thanks so much for the fast reply! I will try it out 
Cheers,
Rebecca
2 Likes