Hello community,
I am excited to present to you the first new nodes for visualizations that we have created with a completely rewritten visualization framework. We started this effort to get our visualization nodes into a consistent style and generate a more pleasant look & feel for them. With this release we will ship the first 4 nodes in a labs extension called “KNIME Views (Labs)”. The 4 nodes are:
- Scatter Plot
- Line Plot
- Bar Chart
- Table View
These new nodes do not only inline the style of the visualizations, but we also focused on improving the user experience to help you build your visualizations as fast and as easy as possible. We therefore introduced a bunch of features I now want to present to you:
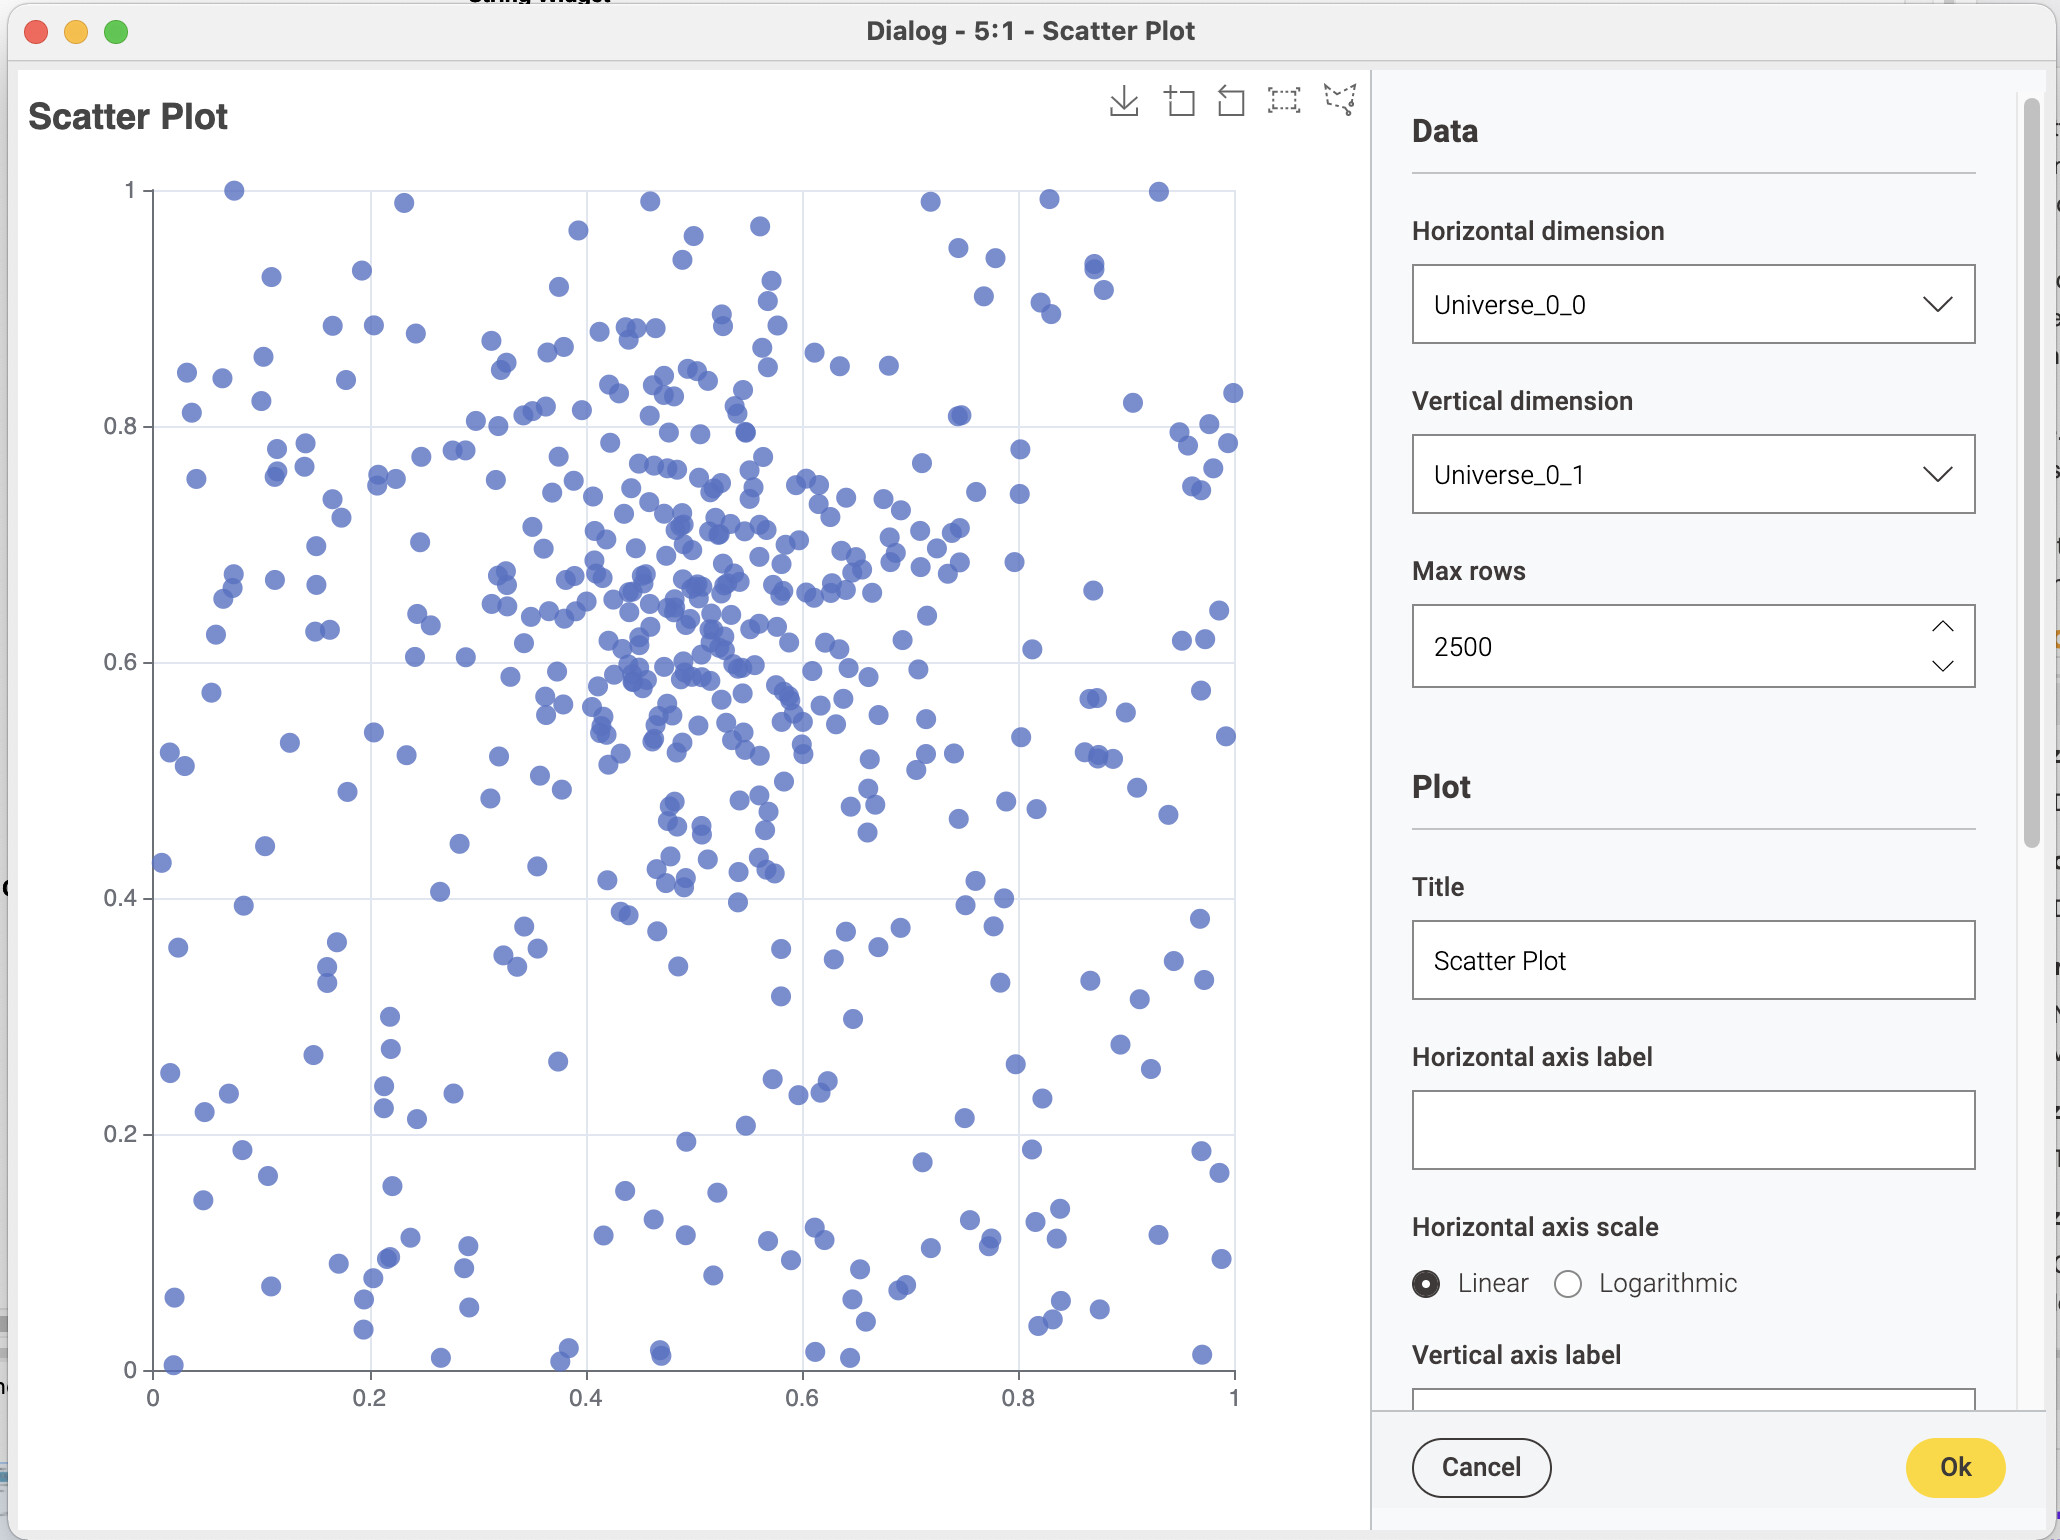
Preview of the view next to the dialog

Preview_next_to_configuration2060×1540 318 KB
What you can see in the screenshot above is the configuration window of the new “Scatter Plot” node. The dialog now always consists of the actual dialog elements and a preview of the actual view next to it. The great thing about this is, that if you now make changes to these settings it will be directly reflected in the actual view. With this reactivity we want you to be much faster on the iterations you need until you arrive at the desired output.
Node descriptions at the corresponding dialog elements

We have introduced setting descriptions right next to the setting where you actually want to use them. You still have the possibility to see the complete node description with all the options if you click on the node, but you also have the possibility now to see the description for the particular setting you are currently at, right next to the displayed setting.
Execution Overlay

Execution_Overlay1031×775 52.7 KB
If the node is not executed you can still access the dialog and configure your node, but the preview of the node is only visible once the node is executed. To enable this inside the dialog, we have introduced this execution overlay, which enables you to execute the node directly in the dialog.
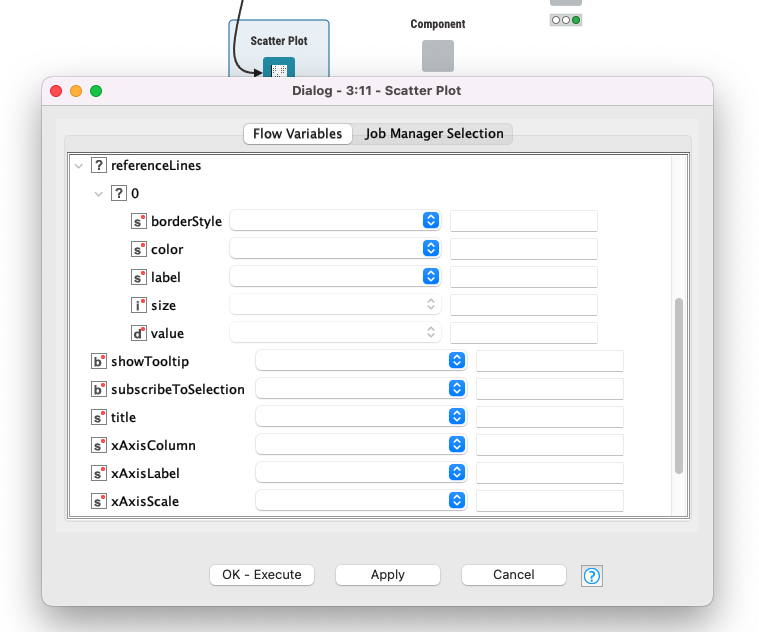
Indication of flow variables
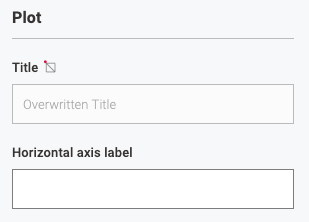
If a setting is overwritten by a flow variable you will notice that the input element is disabled and an icon is displayed next to it. This icon will indicate that this particular setting is overwritten by a flow variable and shows the actual value of the flow variable. This icon will change depending if a flow variable is overwritten or if a setting exposes a flow variable. To configure flow variables you can open the context menu of any new node (right click) and will find a new entry called “Configure Flow Variables…”. This will open the usual flow variable dialog.
More features come in the future
This is just the beginning of the new visualizations. In the future we want to improve these 4 nodes that we have introduced this release and want to release additional visualization types. Furthermore, we are planning to tackle the following bigger topics:
- Image generation
- Color management
- Shape management
Disclaimer
This extension is considered a preview and is currently under development. We might change the appearance of certain settings.
Feedback
We are looking forward to receiving your feedback. So, please reply here with any ideas, comments, or questions. If you run into any problems please follow the Bug Reporting Best Practices.
Example Workflow
There is an example workflow to showcase how to use the new views in conjunction with flow variables: KNIME Views (Labs) - Variables Handling – KNIME Hub
Known Issues
This is a list of known issues that we are aware of and are trying to fix at the moment.
- If you select the text of an input with your mouse and input new content the input will be displayed in reversed order
- Sometime the legend overlaps with the chart title
- For the Bar Chart the axis labels often overlap with the axis ticks
Call to Action
Take a look at the nodes in action (A Virtual Tour of KNIME Analytics Platform 4.6.0 | KNIME) or try them out yourself by downloading the extension (KNIME Views (Labs) – KNIME Hub).
If you are missing any functionality, find anything that does not behave as you would expect it or want to see an additional visualization as a next node please reply with your feedback to this thread.