I am trying to find out if there’s a way to have the tooltip show more than just the x/y information in the standard Scatterplot node. I found a few older requests, but no answers.
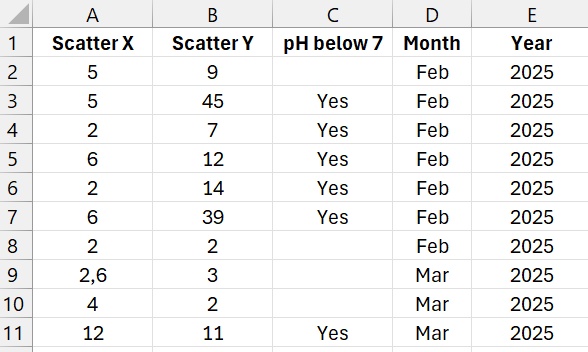
The data I would like to visualize looks similar to this (short version, usually much larger):
I would like to have a tool tip that not only shows columns A and B (x and y, as seems to be standard), but also information from columns C, D, E etc (and more, if in the table). I already use colours for another dimension (e.g. the date), but this is only one other information and seems not expendable. My KNIME version is 5.4.0.
I would be grateful for any advice, thanks a lot in advance!
Kind regards,
Thorsten
Thanks a lot for the fast reply and the idea with the Echarts! I’m looking into that, but unfortunately I am not allowed to use the AI functions; so I’m trying to derive the right syntax for Knime from the “general” syntax for Echarts right now.