I have a color change question regarding the labs visualization node in KNIME 4.7.7.
For regular Bar Chart, there is a port to change the color, so I designated it as Color Manager, but for Labs nodes used in version 5, there is no setting window to specify the color.
Is there any way to change the color of the Labs node or the visualization node in version 5?
In version 5, I can change the color of a specific node, Bar Chart (JavaScript), but I can’t see the visualization immediately like in Labs.
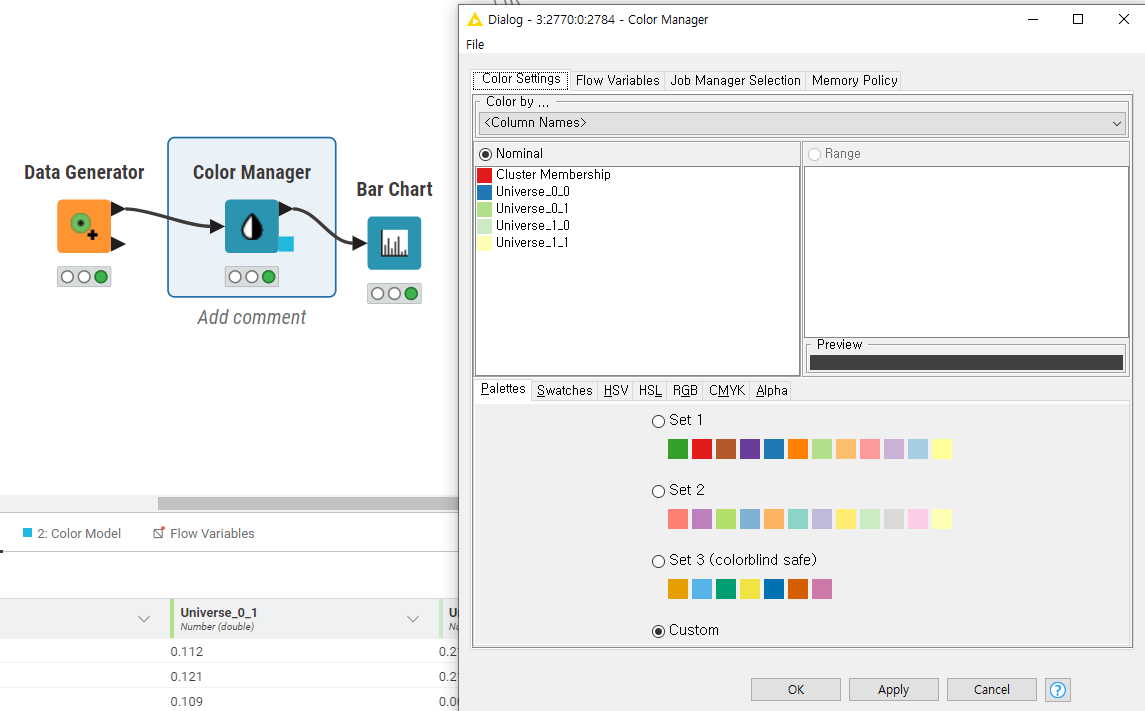
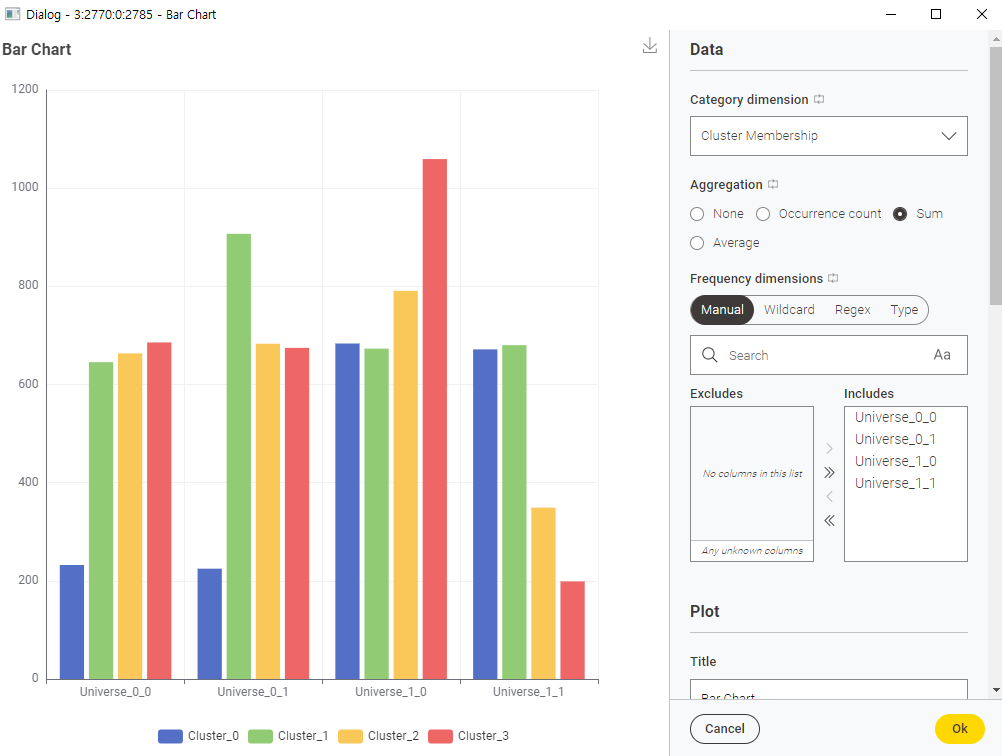
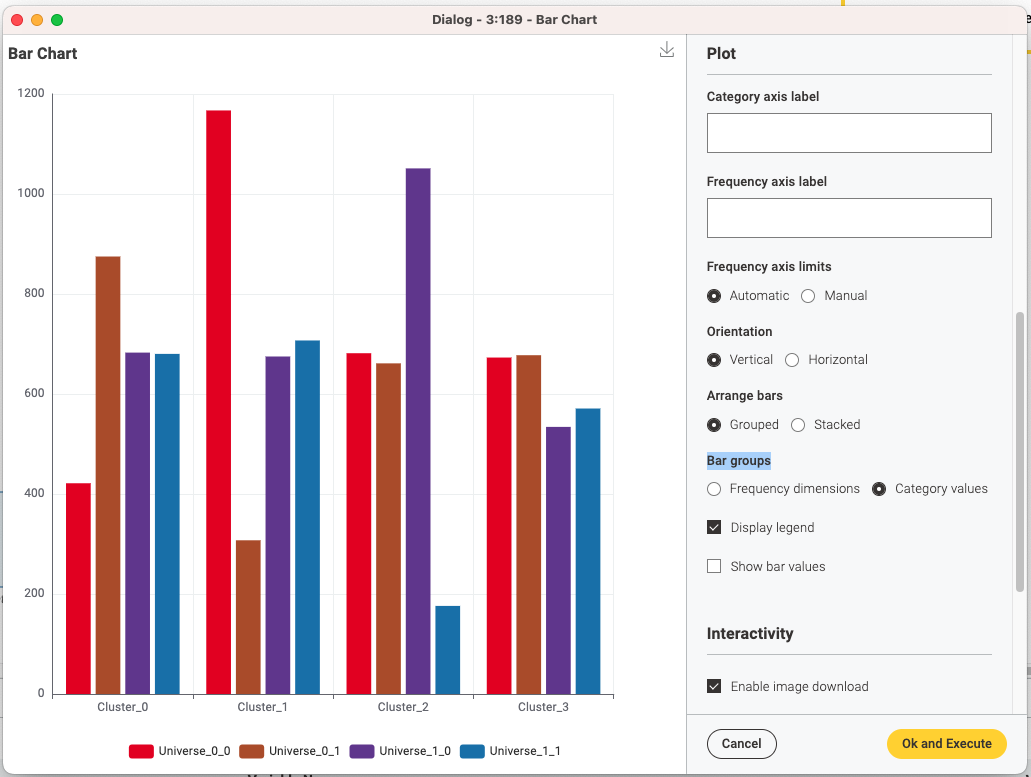
we recently released 5.2 and with it some improvements to make coloring the new views easier. As can be seen in the attached screenshot you don’t need a color port anymore. Even for the Bar Chart you can now select to color entire columns which can then be picked up by the Bar Chart. We also changed the default grouping for the bar chart node to make it row based instead of column based to make it a bit more intuitive.
You have to make sure that you set the grouping to “Category values” if you want to color by column names. If you want to have the grouping by frequency values you have to color the individual row values (in this case Cluster_0, Cluster_1… in the color manager).