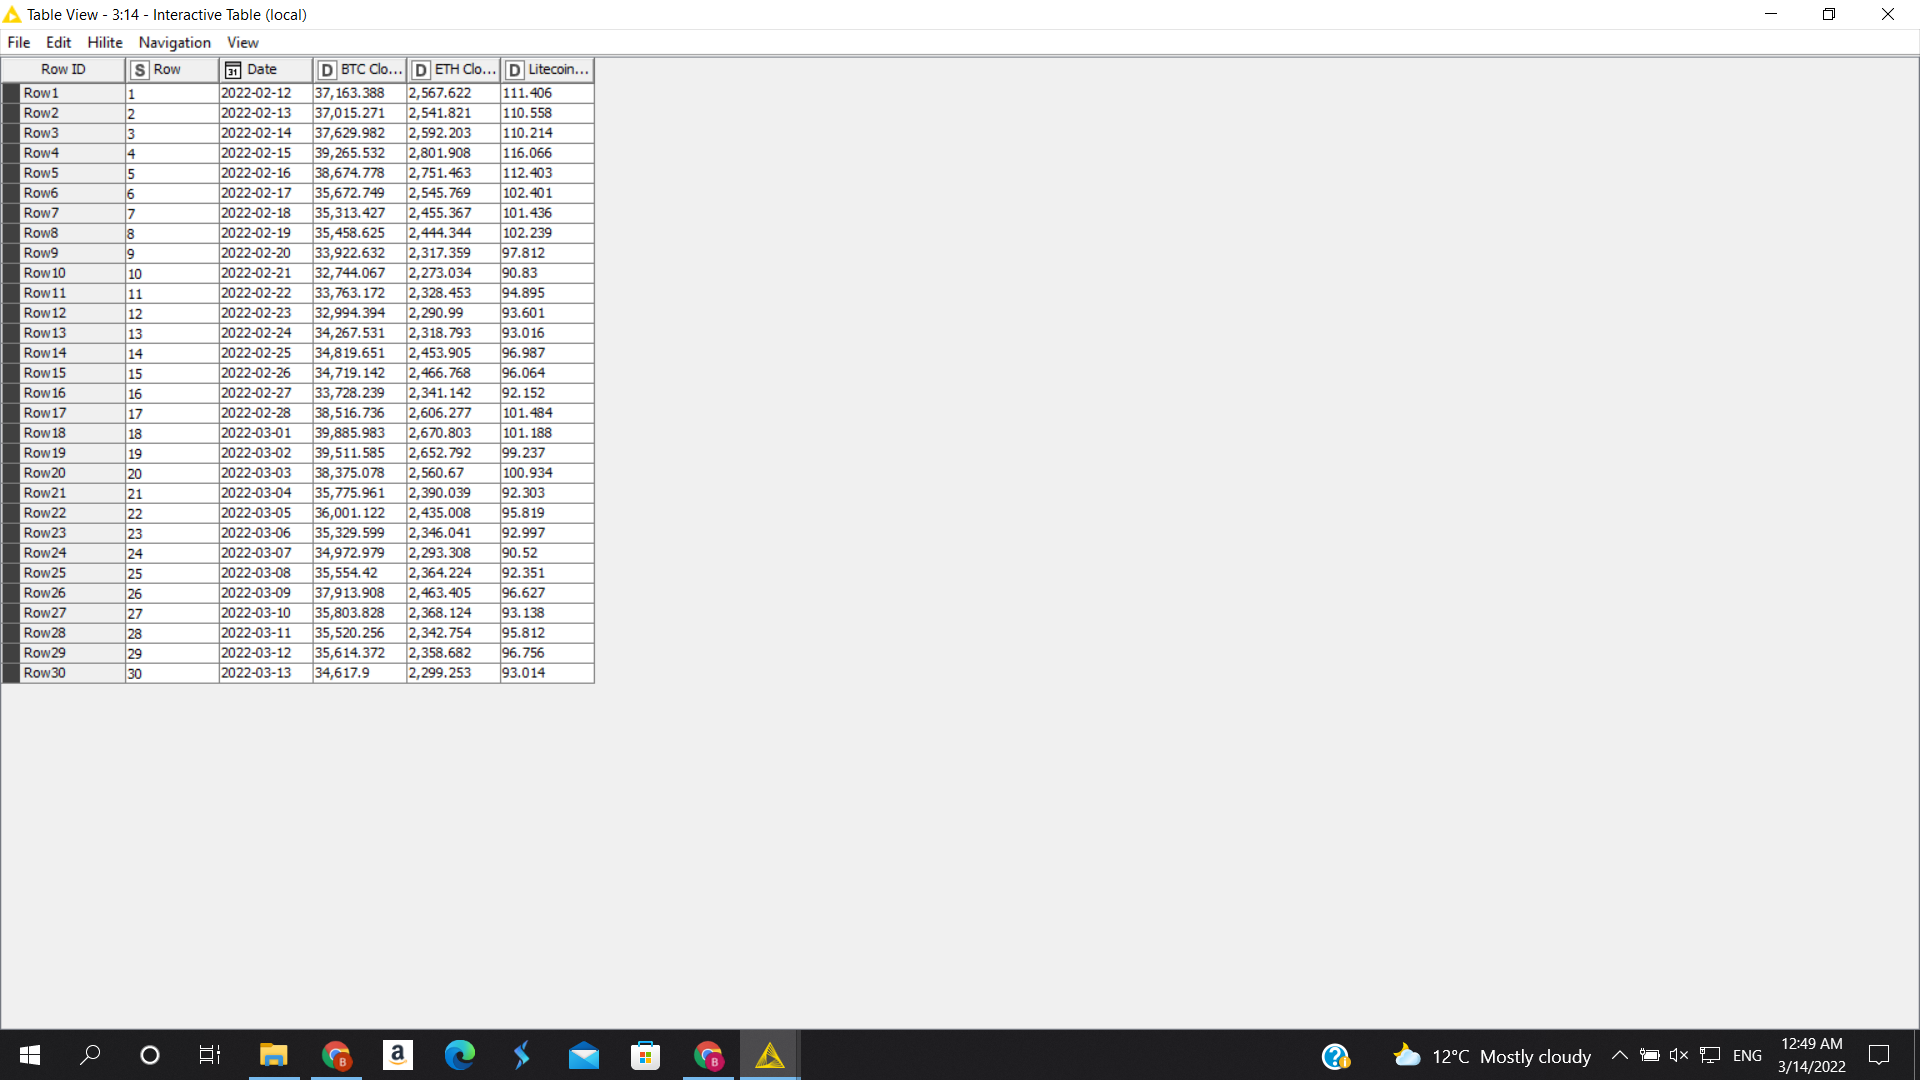
How do i create a graph for each of the crypto alone vs. the date, i have tried line plot (plotly) and the line plot but it seems if i create one image the others won’t execute and they are stuck on 40%.
Hi @Baha_s and welcome to the forum. I moved your question to a separate topic since it wasn’t related to the topic you originally posted on.
Below is a simple example of how you can set up various Line Plots:
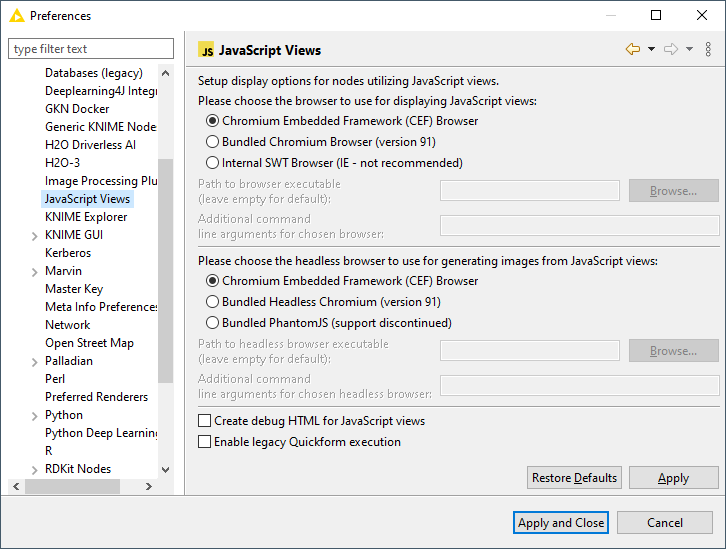
If you are having trouble with some of the plots getting stuck, you can make some changes to your settings to see if this improves results. Go to File → Preferences → KNIME → Javascript Views and change from the CEF browser to the Bundled Chromium browser: