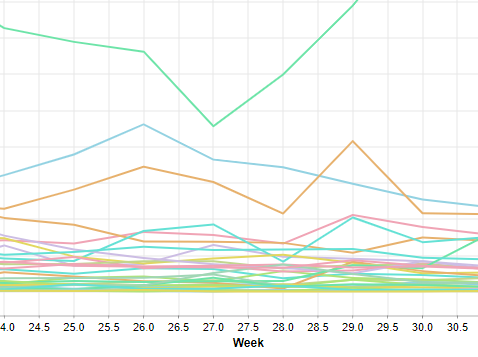
I’m using the line plot to show weekly activity, but it’s adding half-week points e.g. 26.5 weeks when there is no data for half-week amounts.
How can I get it to only show 25, 26, 27 etc and not the half weeks?
I’m using the line plot to show weekly activity, but it’s adding half-week points e.g. 26.5 weeks when there is no data for half-week amounts.
How can I get it to only show 25, 26, 27 etc and not the half weeks?
Hi @RIchardC
Convert week (from Double??) to Int…
gr. Hans
I fixed this by using plotly. Cheers.
This topic was automatically closed 7 days after the last reply. New replies are no longer allowed.