KNIME_praxisprojekt_Truck2.knwf (4.0 MB)
Hi Community,
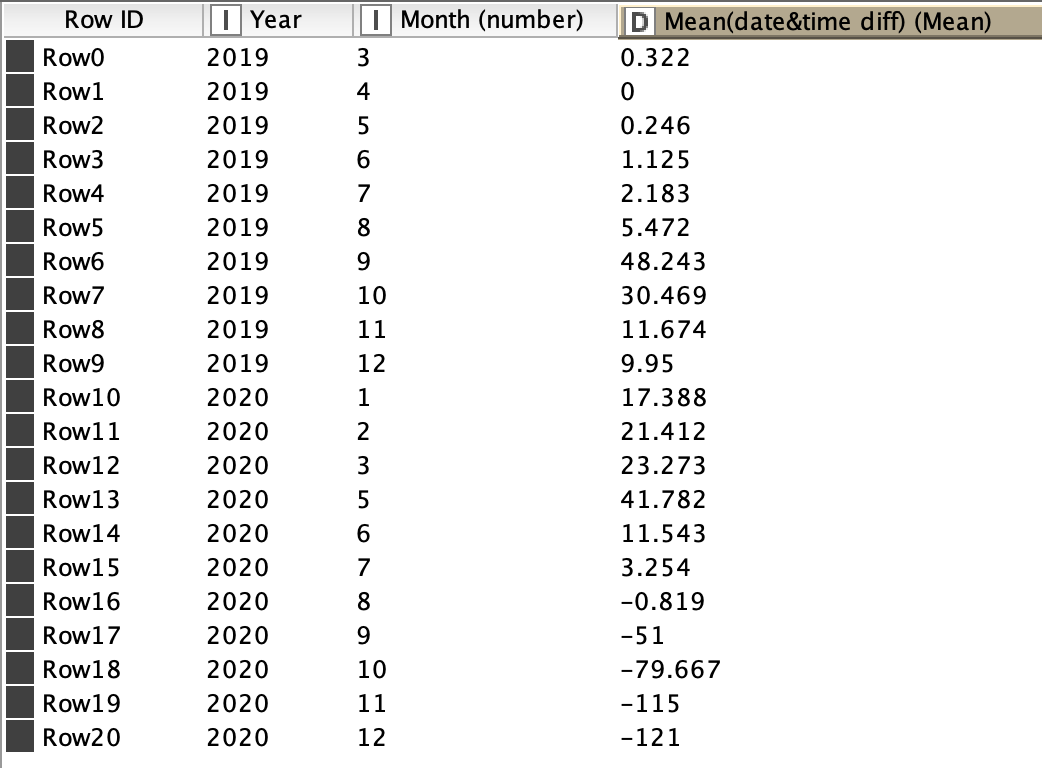
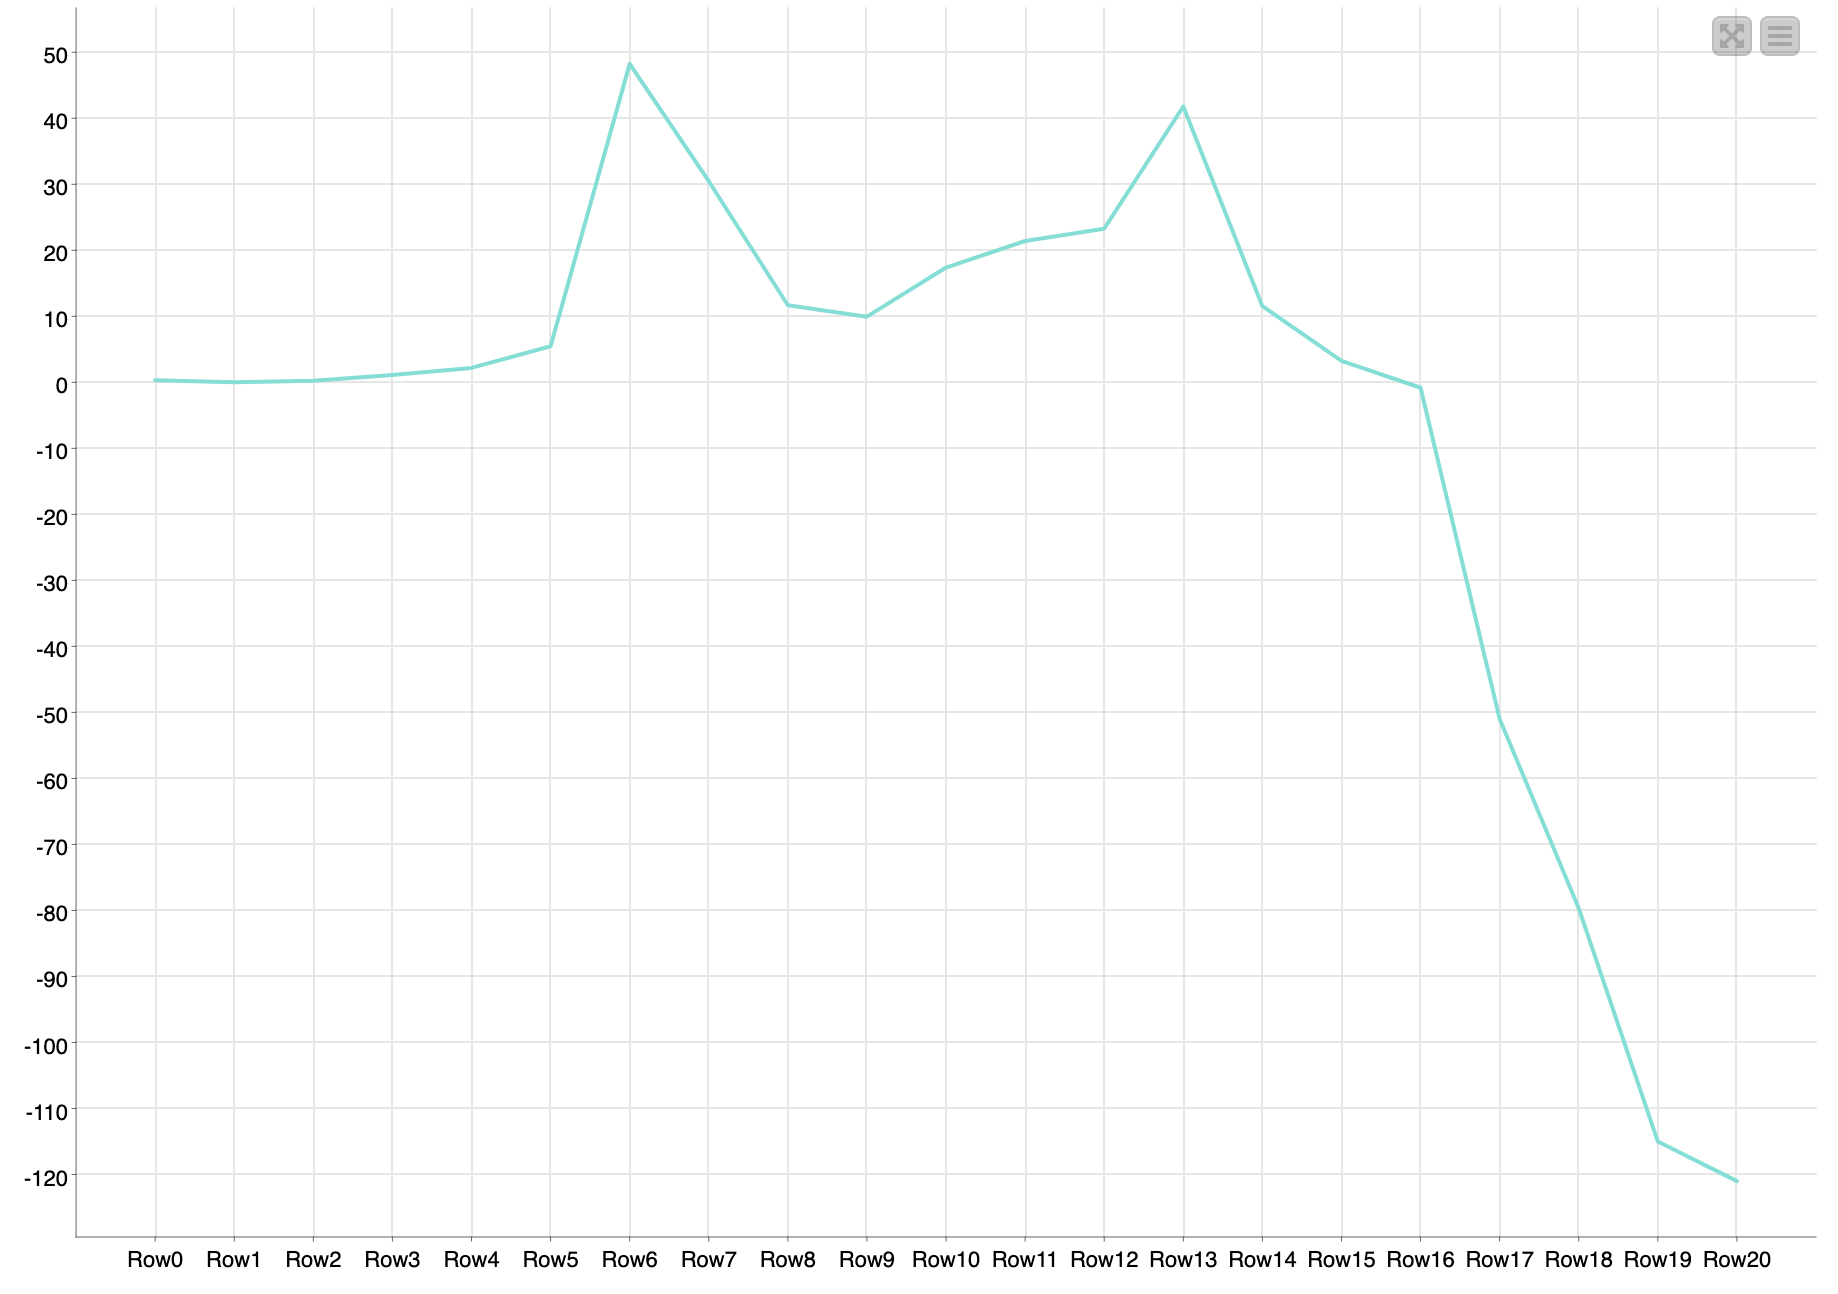
is it possible to display the x-axis with Year + Month? I could only choose on column and doesn’t know how to show it with both year and month.
Appreciate for the help!
Best Regards
KNIME_praxisprojekt_Truck2.knwf (4.0 MB)
Hi Community,
is it possible to display the x-axis with Year + Month? I could only choose on column and doesn’t know how to show it with both year and month.
Appreciate for the help!
Best Regards
Change Year and Month to string (Number to String node) and then join with String Manipulator node. Use the resulting column as the X-axis.
In the String Manipulator node create the follwing:
join($Month$,“/”,$Year$)
(or whatever you’ve named your month and year columns) Append the new column w/ a meaningful name. You can order the month and year anyway you want and use another separator. The new column can then be used as your x axis.
This topic was automatically closed 7 days after the last reply. New replies are no longer allowed.