Hi there,
just yesterday I held a L1-AP session where we had a look on the plotting capabilities of KNIME. One of the starter nodes is the “Line Plot” node. This node is often used to plot time series data.
Now I wanted to show how to set up the plot and change the data ranges of x and y.
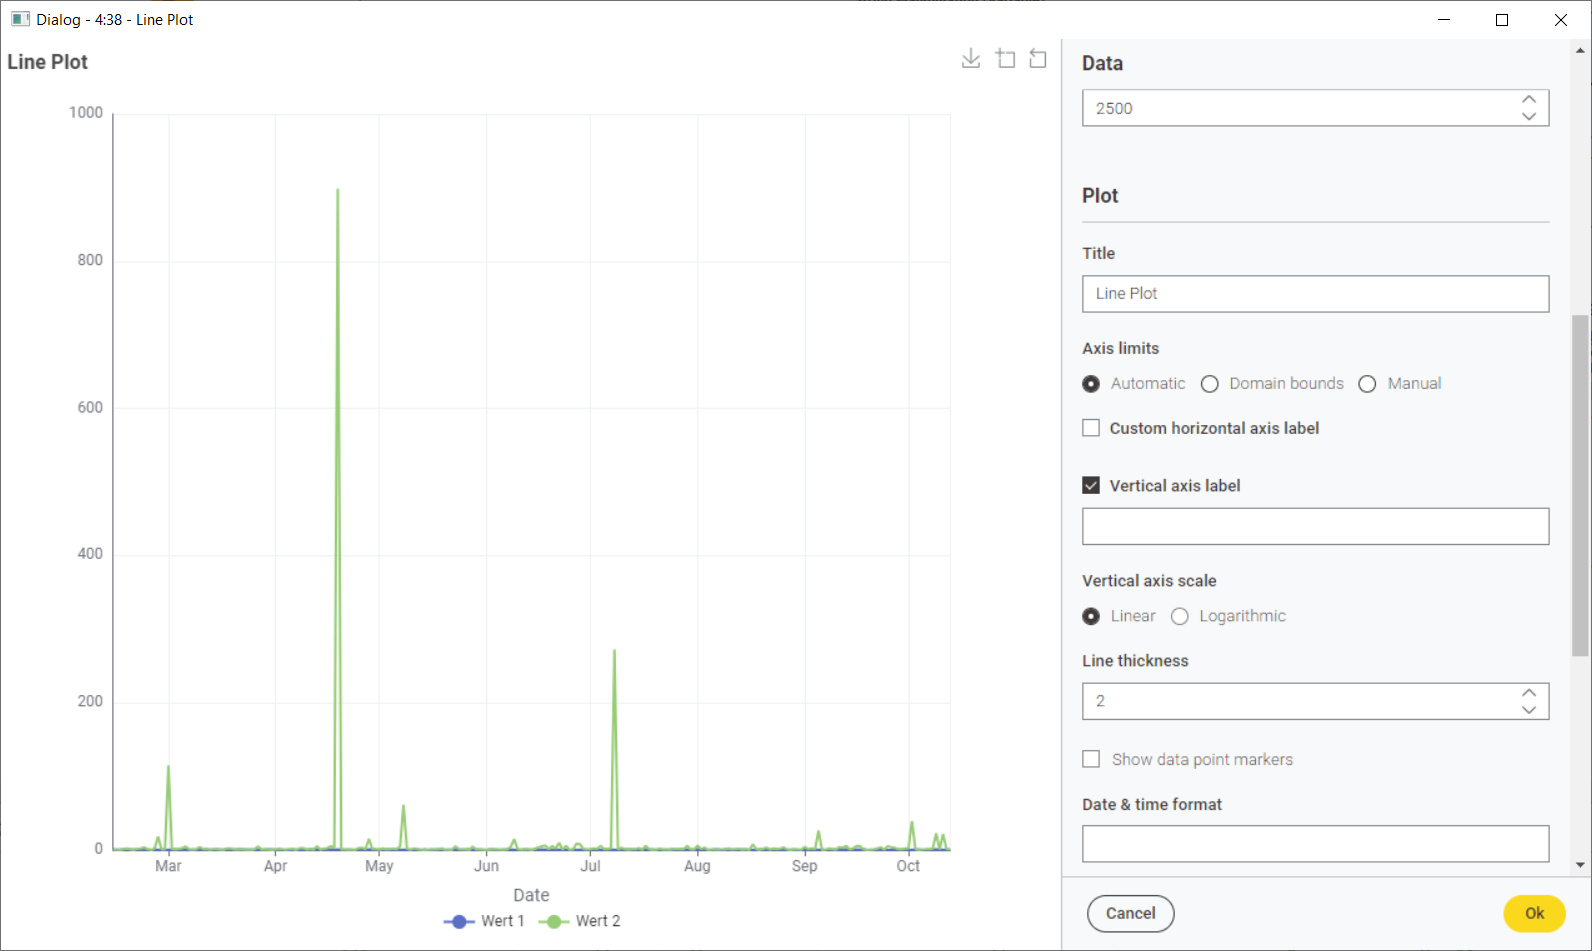
Is is the view with automatic limits:
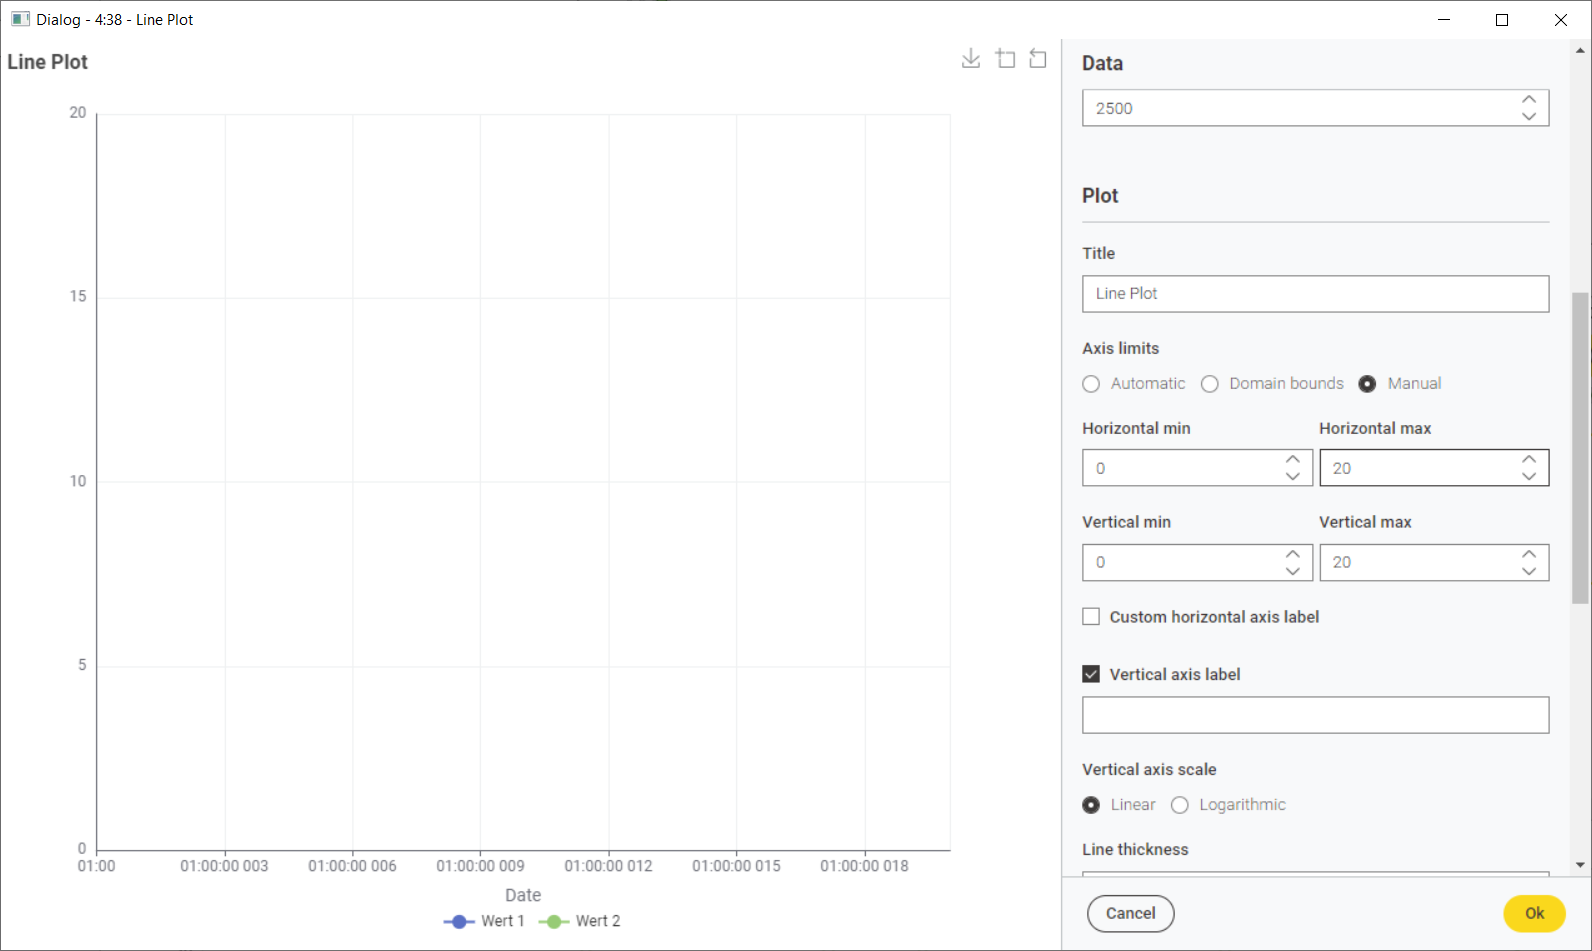
When I activate “Manual”: It automatically sets min and max to 0 and 20 for both axes:
I had to do some research to find out, that the x-axis limits need now UNIX-timestamps in miliseconds to work correctly.
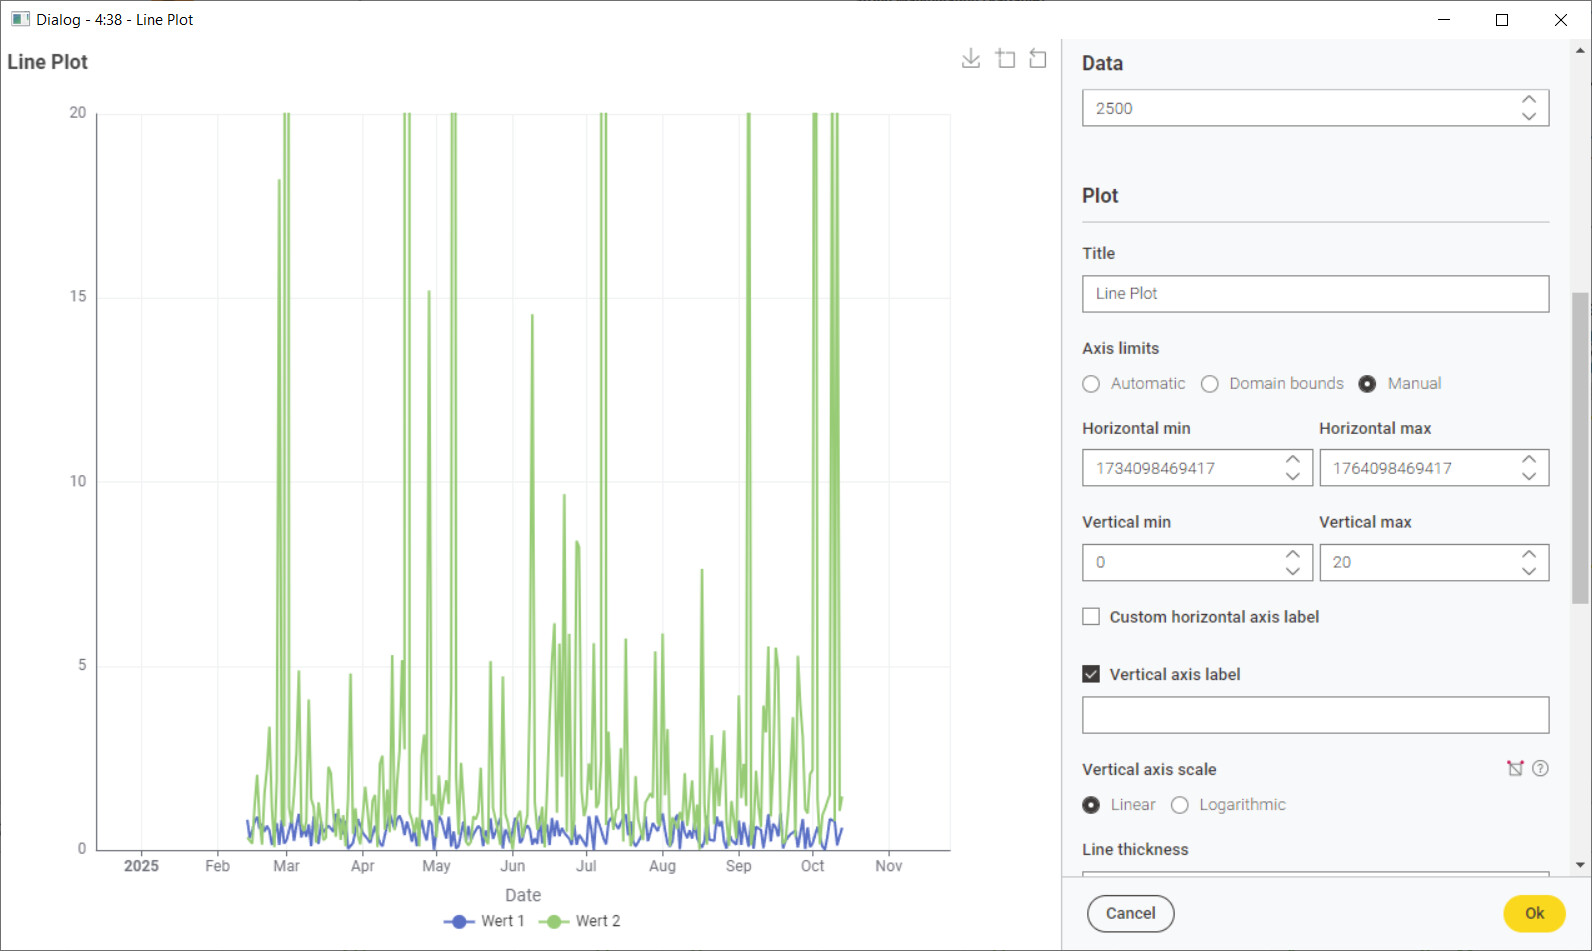
I think this behaviour is not very user-friendly.