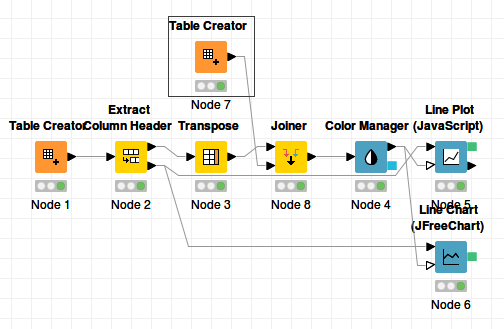
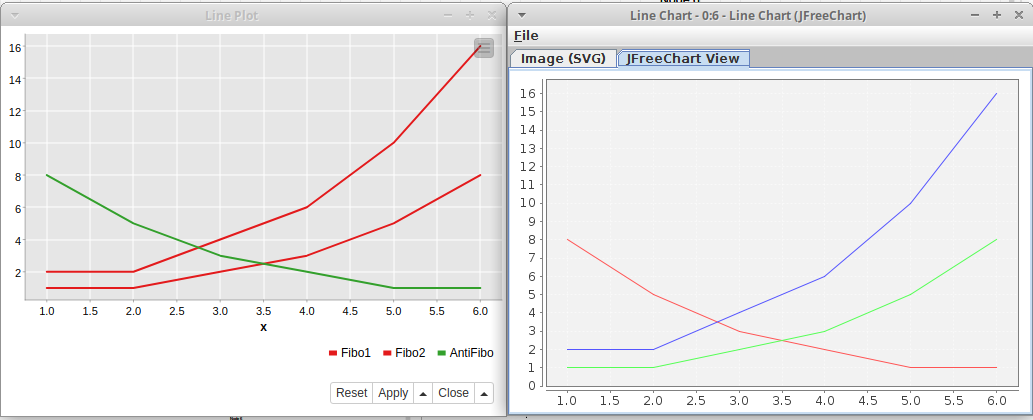
In this little workflow, the LinePlot (JavaScript) shows the colors assigned by the Color Manager node, as expected. However, the Line Chart (JFreeChart) chooses its own colors. I don’t understand why. Bug or feature?
I saw a post from last year by @evert.homan where he seems to have a similar problem with the Line Chart (JFreeChart) node but it was not solved. Of course, I could just use the JavaScript node, but the JFreeChart node is much faster, which is important if I want to create many plots in a loop.
The two nodes DO behave the same when I use a column containing the original column names in the Color Manager node. But when I use a separate categorical variable column for the coloring, the JFreeChart Line Chart Node does not use the assigned colors, while the JavaScript Line Plot node does.
No-one can help? My loop takes more than one hour with the Javascript plotter while it would be finished in a few minutes with the JFreeChart equivalent.
besides the problem have you tried to choose a different internal browser to create the working JavaScript View. Maybe you could use a minimal browser or something.
Interesting! Thank you for this, I was not aware that one can select different JS engines. It seems to be a bit faster with the PhantomJS engine, but unfortunately still not nearly as fast as the JFreeChart node.