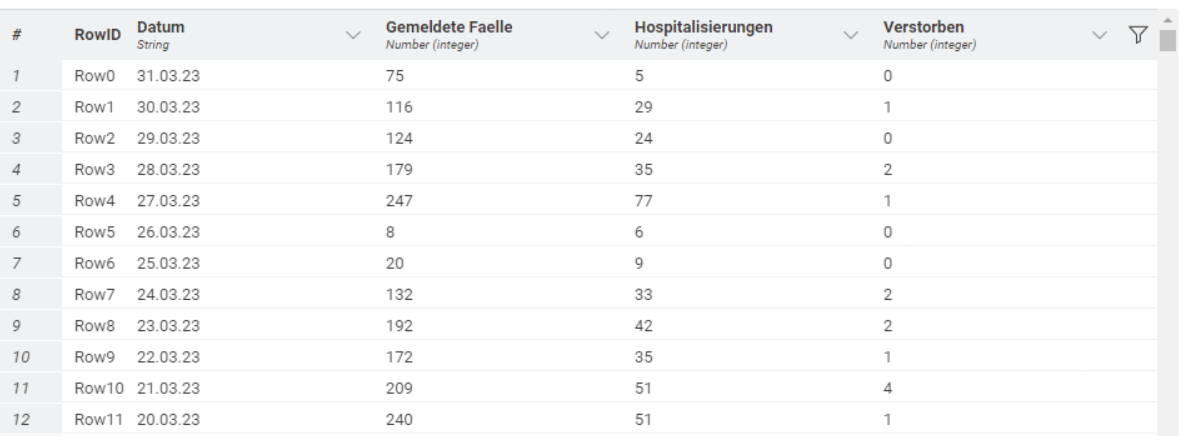
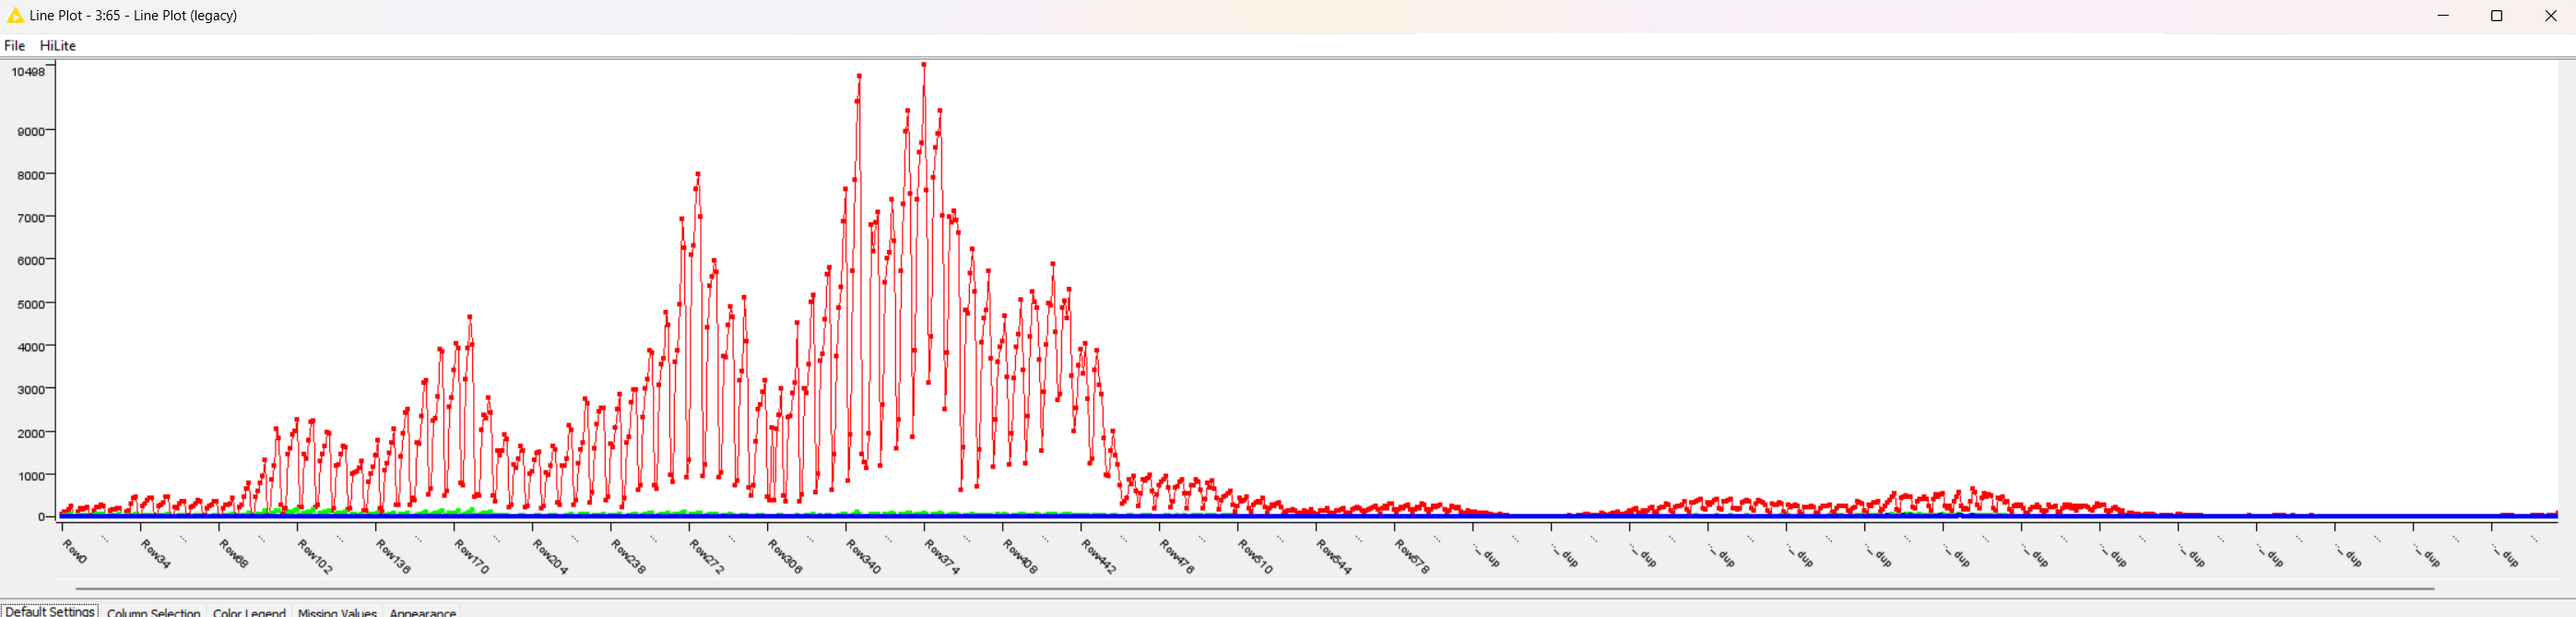
I’m trying to present reported cases, hospitalizations, and deaths trended over time using the Line Plot (legacy) node but somehow it ignores the Date Column and uses the RowID column for the X-axis’s value. I tried converting the date to string yet the problem remained the same.
Hello @siarN1,
The Line Plot (legacy) node is designed for numerical data only.
Instead, you can use the Line Plot (JavaScript) node.
2 Likes
Hey,
I would recommend, that you go for the new nodes. The new Line plot does not only accept date&time, but make us of it, so that it interpolates if you zoom in.
Greetings,
Daniel
2 Likes
hi @tqAkshay95 thank you, i will try Line Plot (JavaScript) node.
1 Like
hey, @DanielBog I did use the new node for Line Plot but to my limited knowledge, I couldn’t figure out how to achieve the result I hoped for. Nonetheless thank you for your feedback
dear @DanielBog take another look at the screenshot above, the x-axis is not showing the rowID instead of the Date column. and I want to compare these three other columns (reported cases, hospitalizations, and deaths) inside the line plot.
Hey @siarN1,
are you referring to the image in your first post? This is not the new line plot node.
Greetings,
Daniel
This topic was automatically closed 7 days after the last reply. New replies are no longer allowed.