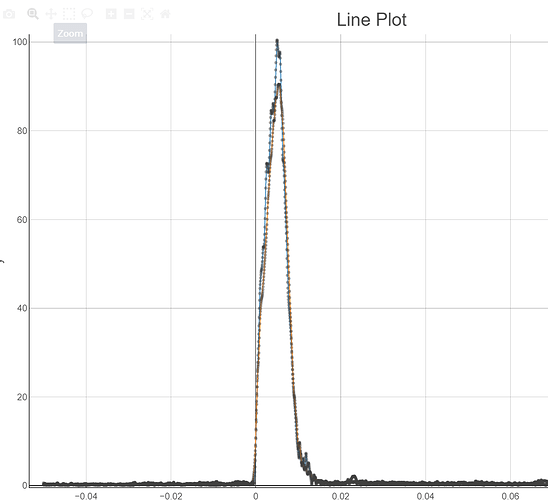
Hi, I am creating a line plot with two different lines using the Line Plot (Plotly) node. I am trying to make the plots easier to read and am having trouble doing so. Here is an image of the plot.
Is there away to get rid of the data point markers?
Thank you
