Dear Knimers,
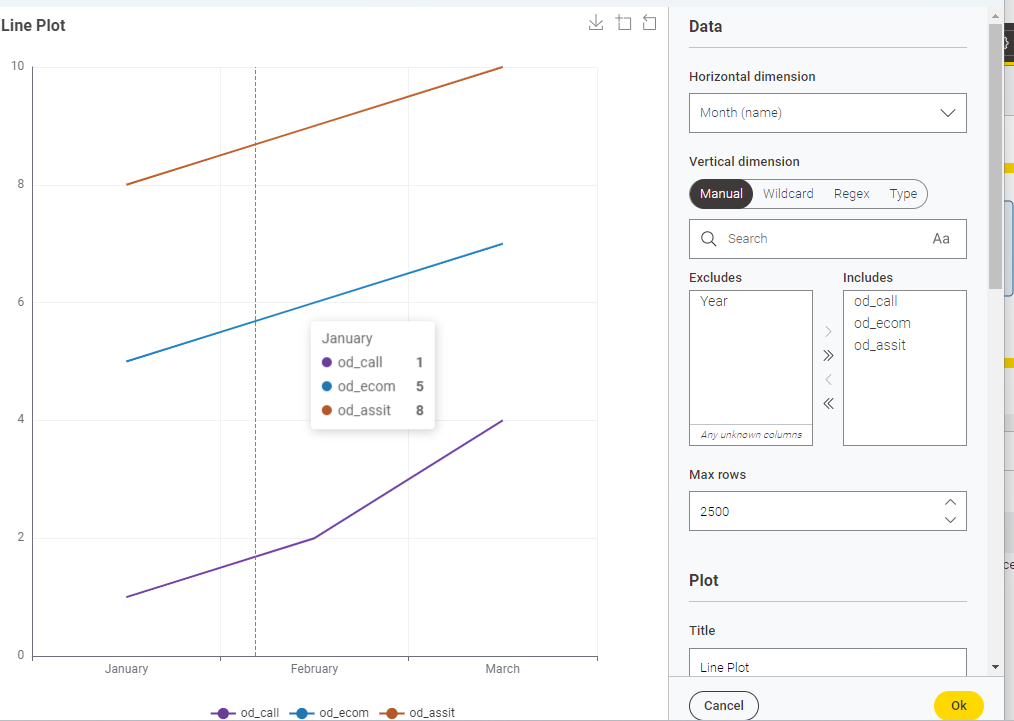
I need to build a Line Plot with three different lines, each one on its own color. I have dates for the x-axis, and three different columns with the (integer) values of three variables to be represented on y-axis. The configuration of Color Manager node offers me just one option, which is I cannot find how to assign colors to more than one column.
I would appreciate any help.
Thanks. Rogério.
Hey @rogerius1st,
we recently added the ability in the Color Manger node to color whole columns. (I think with 5.2.0)
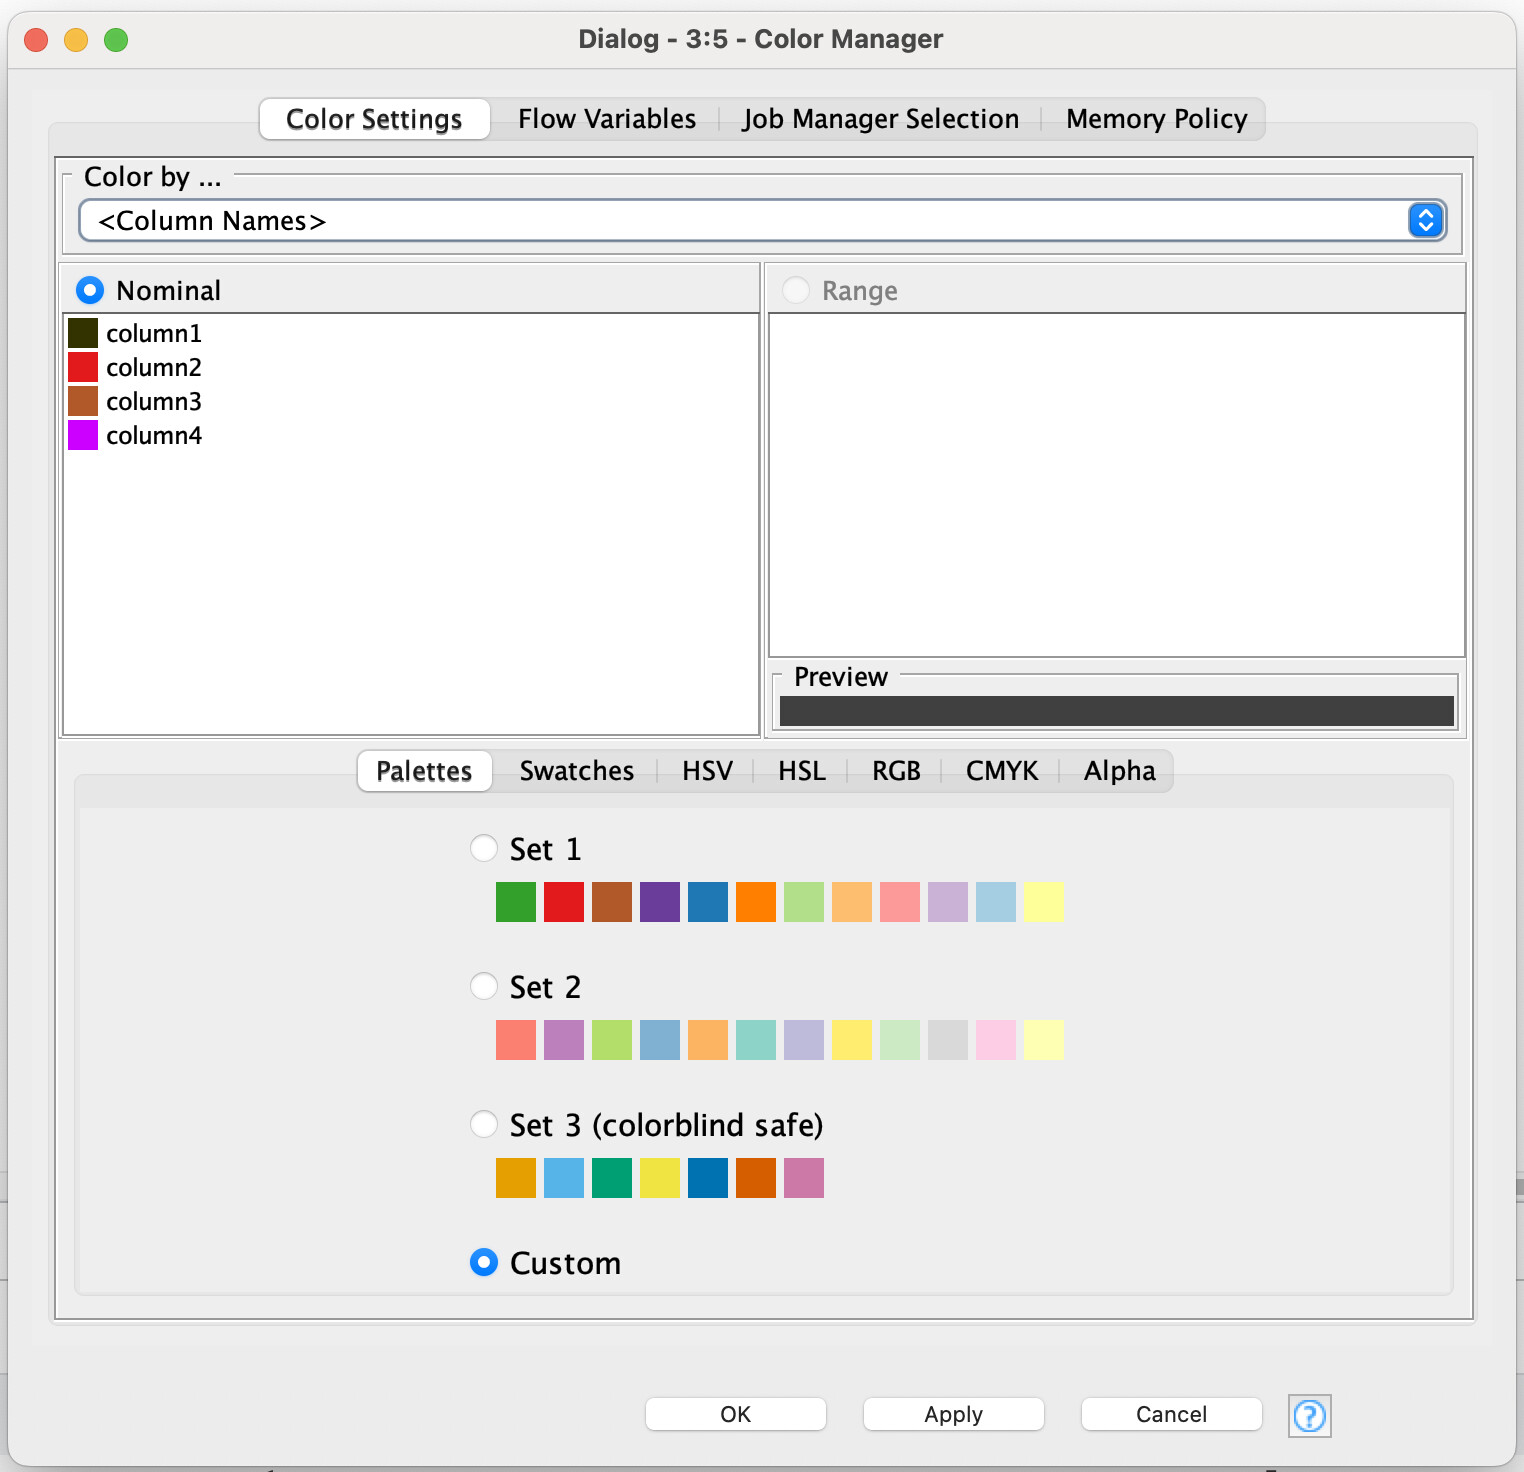
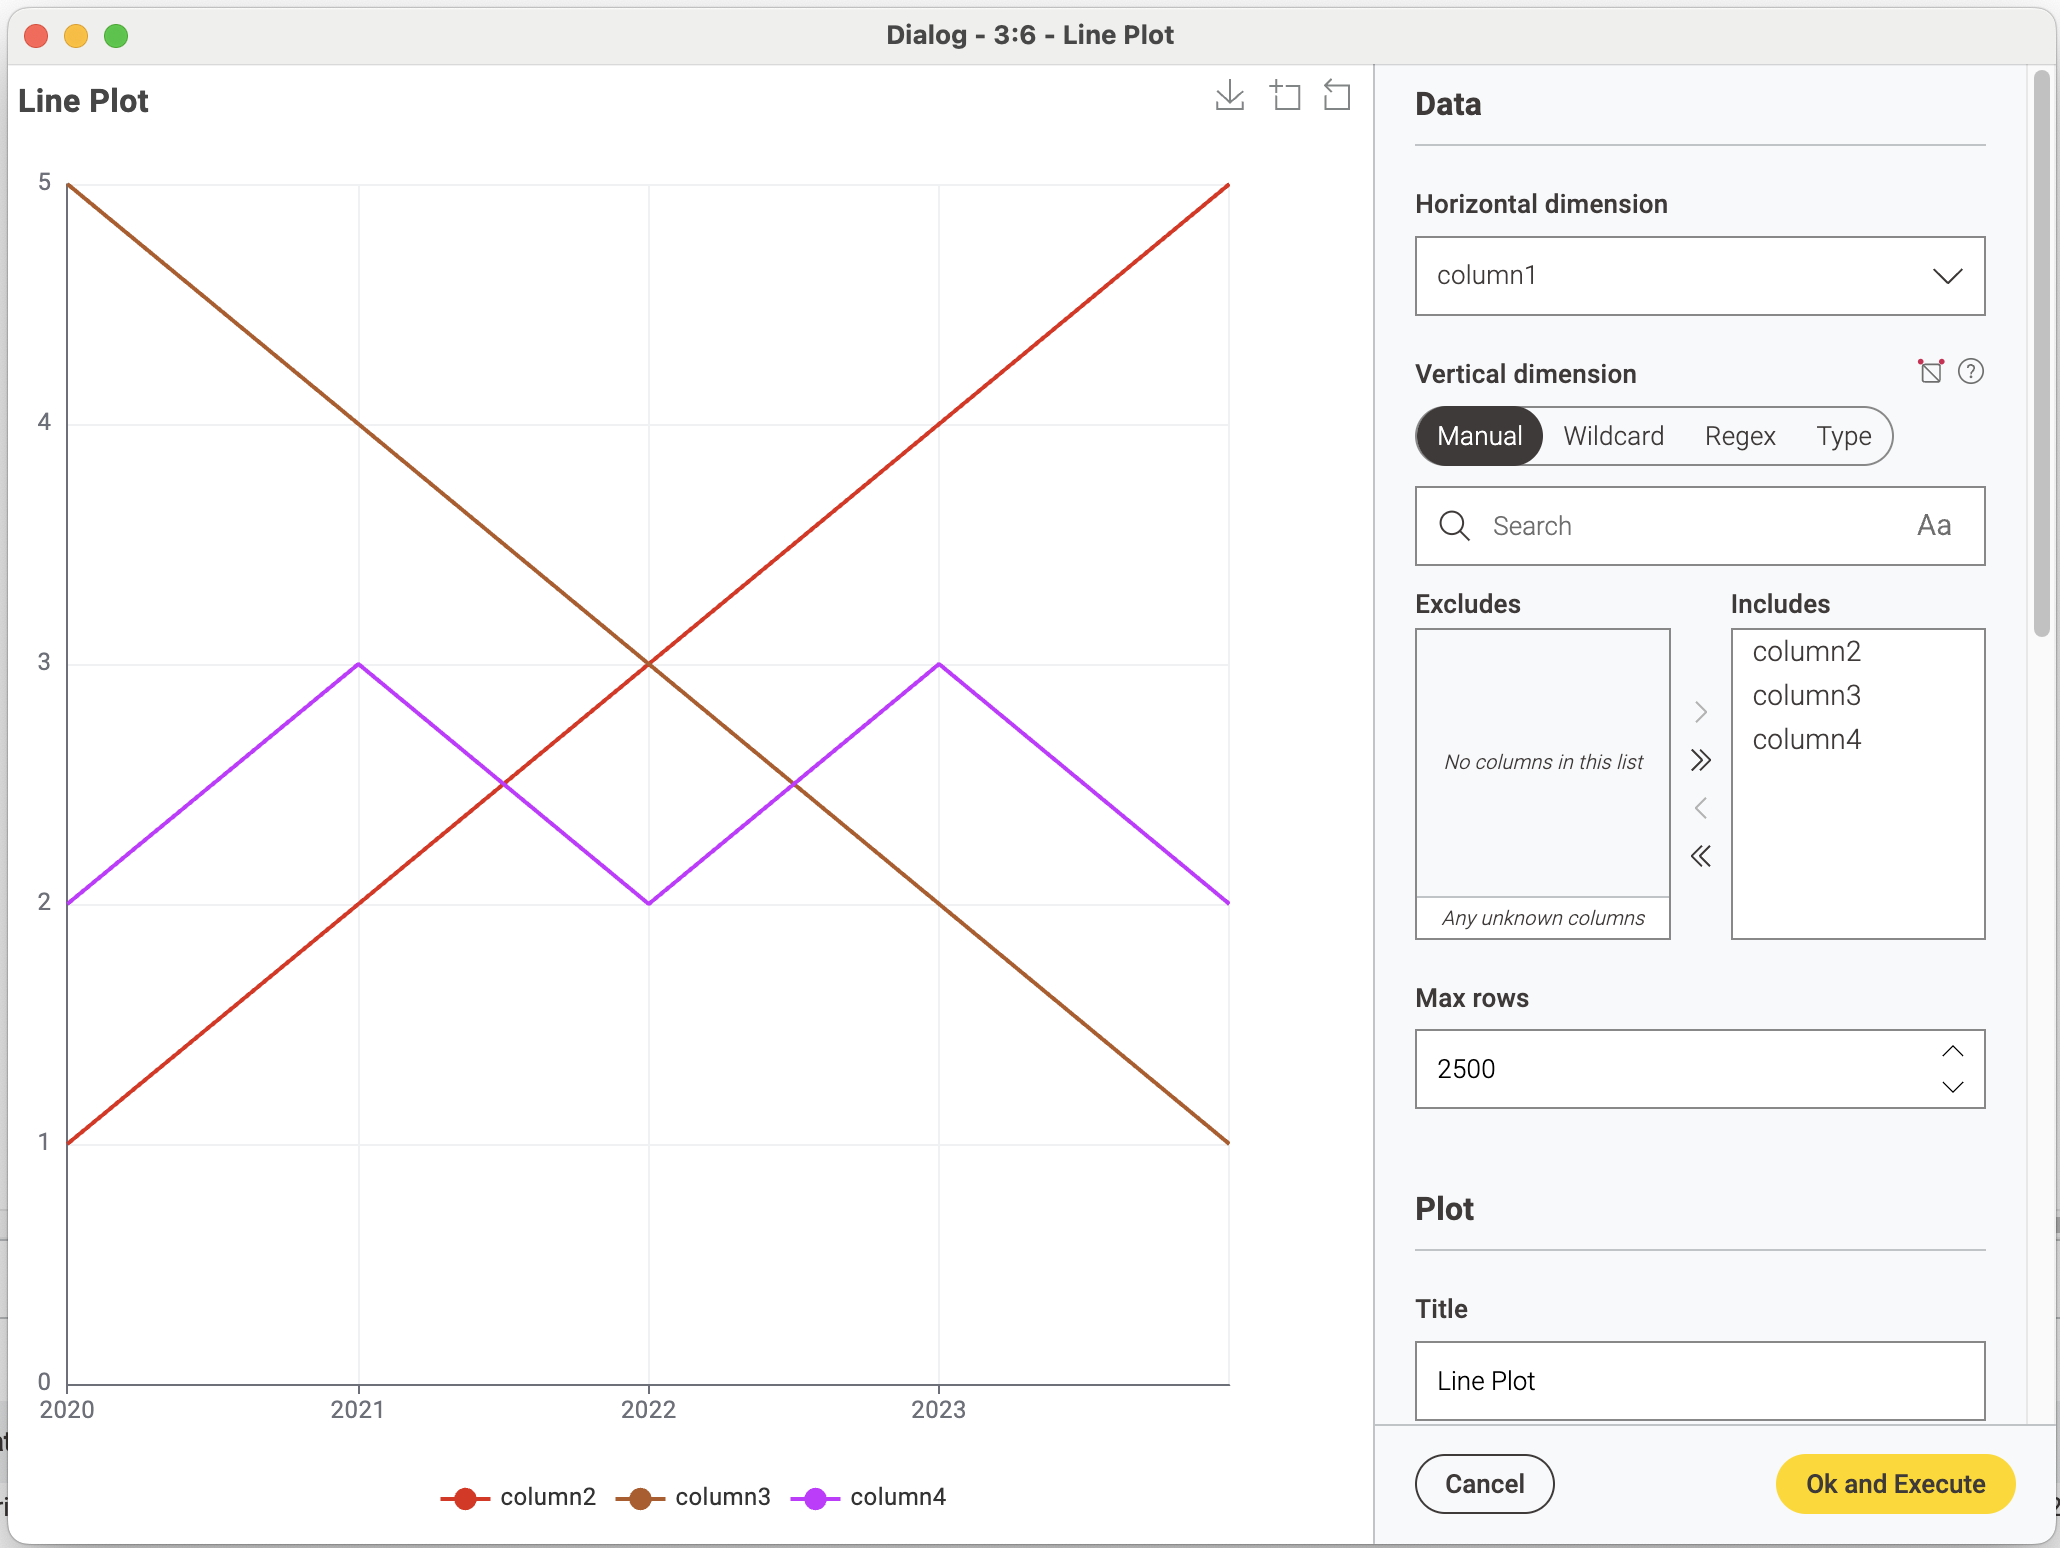
Once you have done this, the new Line Plot node will use these colors and the lines should be colored accordingly.
See the attached workflow for more details.
ShowcaseLinePlotColoring.knwf (74.8 KB)
Let me know if that helps.
Greetings,
Daniel
3 Likes
Hello @rogerius1st,
Yes, I agree with @DanielBog.
You can use the Color Manager node before the line plot.
For your reference, attached are images.
Dear @DanielBog (and @tqAkshay95),
Sorry that I haven’t properly explained my issue. It was all my fault, and mine alone. I’ll try to do it better, now:
My question was while configuring the node “Color Manager”, but dealing with data in the formats “Integer” or “Double”. I have a file with four columns: one with dates (in the “Date” format), expected to be assigned to the x-axis; and three other columns (for three variables), expected to be represented on the y-axis, all of them in the format “Double”. This file is:
CSV file with Casas Hosps Deaths for a three-colored Line Plot.csv (107.9 KB)
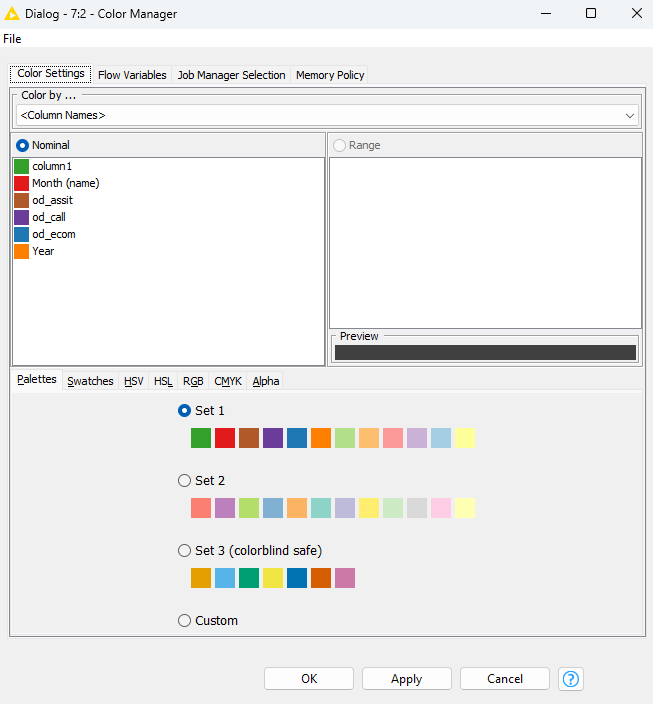
I already updated my current Knime version to 5.2.0. but the “Color Manager” node only allows me to assign colors to one nominal column (at a time). Instead, my three columns have data in the format “Double”, and I need to compare all of them at once.
I wish to connect this file to a “Color Manager” node, and then to a “Line Plot node”, to build a graph with three curves, with three different colors. Thus I would get a real-time comparison among these variables.
Any help would be very welcome.
Thanks to everyone.
Bye, Rogério.
Hey @rogerius1st,
no need to be sorry, maybe it is also me missing something.
I still don’t get it 100% isn’t the workflow that I attached exactly solving your problem?
I attached another workflow with the data you provided.
ShowcaseLinePlotColoring.knwf (76.4 KB)
Greetings,
Daniel
1 Like
Dear @DanielBog (and @tqAkshay95),
Sorry, but the suggested workflow has the same possible configurations for the Color Manager node as I’ve found before (choosing colors for just one column at a time).
In the meanwhile, I’ve found the post from @AlexanderFillbrunn :
(https://forum.knime.com/t/how-to-apply-colors-to-different-columns/23442/4)
which helped me to build the desired graph, just as I needed (and expected).
Thank you all for all your help.
Rogério.
Hey @rogerius1st,
I am still interested in understanding the problem.
could you please share your workflow?
We introduced this new option to make the solution from @AlexanderFillbrunn not necessary anymore.
Greetings,
Daniel
Dear @DanielBog ,
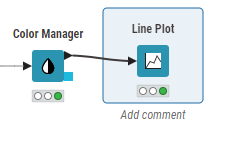
Although (by now) I’m not able yet to share the whole workflow – because it’s the core part of a scientific article that I’m currently writing, wishing it to be published in a recognized journal – the part of this workflow, concerning my problem (already surpassed by applying the solution of @AlexanderFillbrunn ) is as in the image that follows:
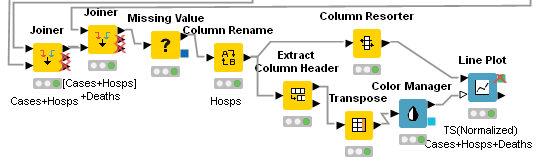
On which I joined three tables (independently preprocessed), and finally I could build the desired three-colored graph.
But answering (more specifically) to your question, the solution you have suggested to me didn’t offer the option of adding colors to more than one column and just accepted categorical columns, which already was what I had in my current “Color Manager” node.
I truly thank you for your ideas, your time and dedication to my issue.
Bye. Rogério.
This topic was automatically closed 7 days after the last reply. New replies are no longer allowed.