Dear all,
I’m looking for a very hard solution for me. I try to explain my problem.
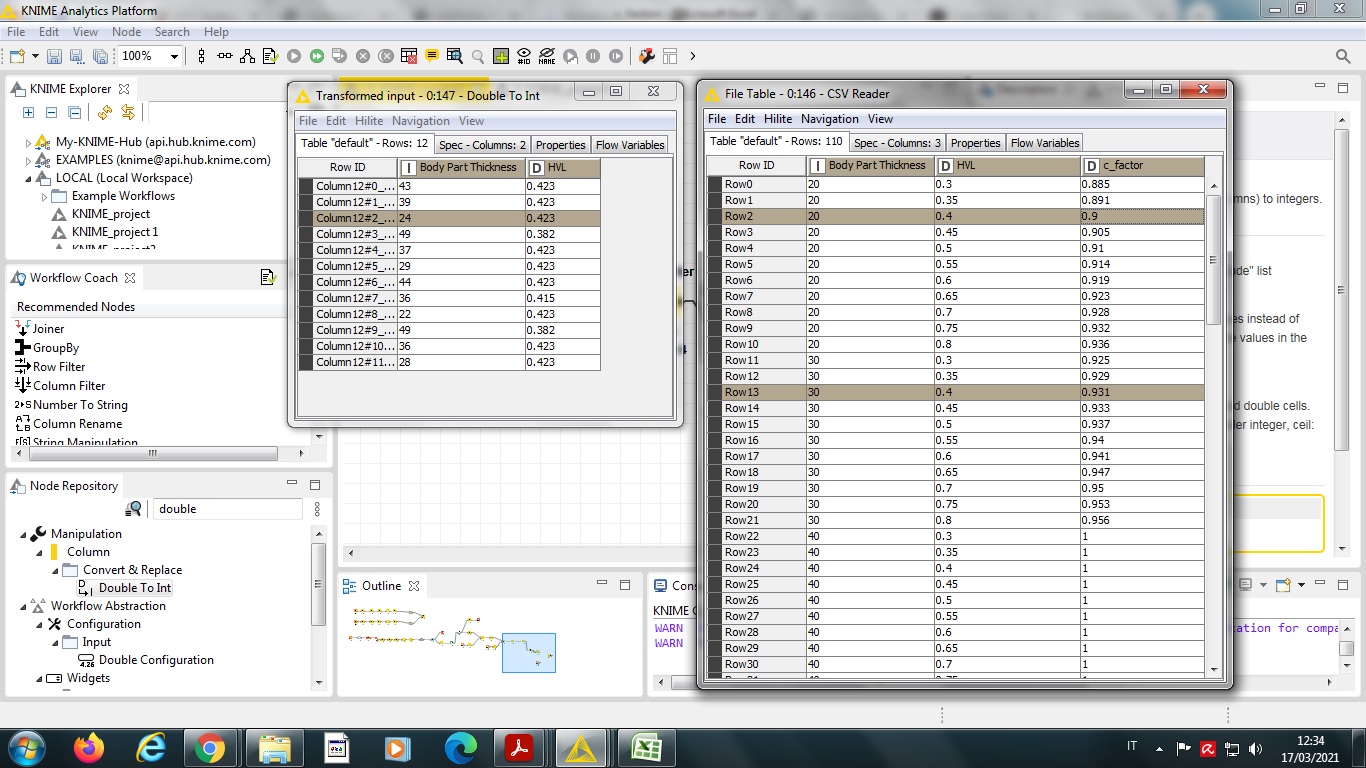
I have two tables: Table1 the experimental data and Table2 the theoretical data.
In Table1, “Body Part Thickness” values range from 20 to 110 (step of 1) and HVL range from 0.300 to 1.115.
In Table2, “Body Part Thickness” values range from 20 to 110 (step of 10). For each “Body Part Thickness” there are 11 possible values of HVL (HVL ranges from 0.3 to 0.8, step of 0.05). Each combination of “Body Part Thickness” and HVL correspond to a c_factor value (third column).
For each “Body Part Thickness” value and each HVL value in the first table, I’d like to find the correspondant c_factor obtained by linear interpolation of theorical data. As a result, I’d like to append a third column to the first table.
I was thinking to approximate HVL values (round to 0.05) in the first table, in order to have comparable value with those reported in the Table2.
Then, I’d like to calculate c_factor associated to experimental data by linear interpolation between theoretical data.
For example:
in Table1 Body Part Thickness= 24 ; HVL =0.423
in Table2 I’d like to interpolate c_factors values from the two rows with “Body Part Thickness” = 20 and = 30, and HVL 0.40, by considering experimental data “Body Part Thickness” =24
Is there a way to do this? Thanks in advance for your answers!