New learner to data mining.
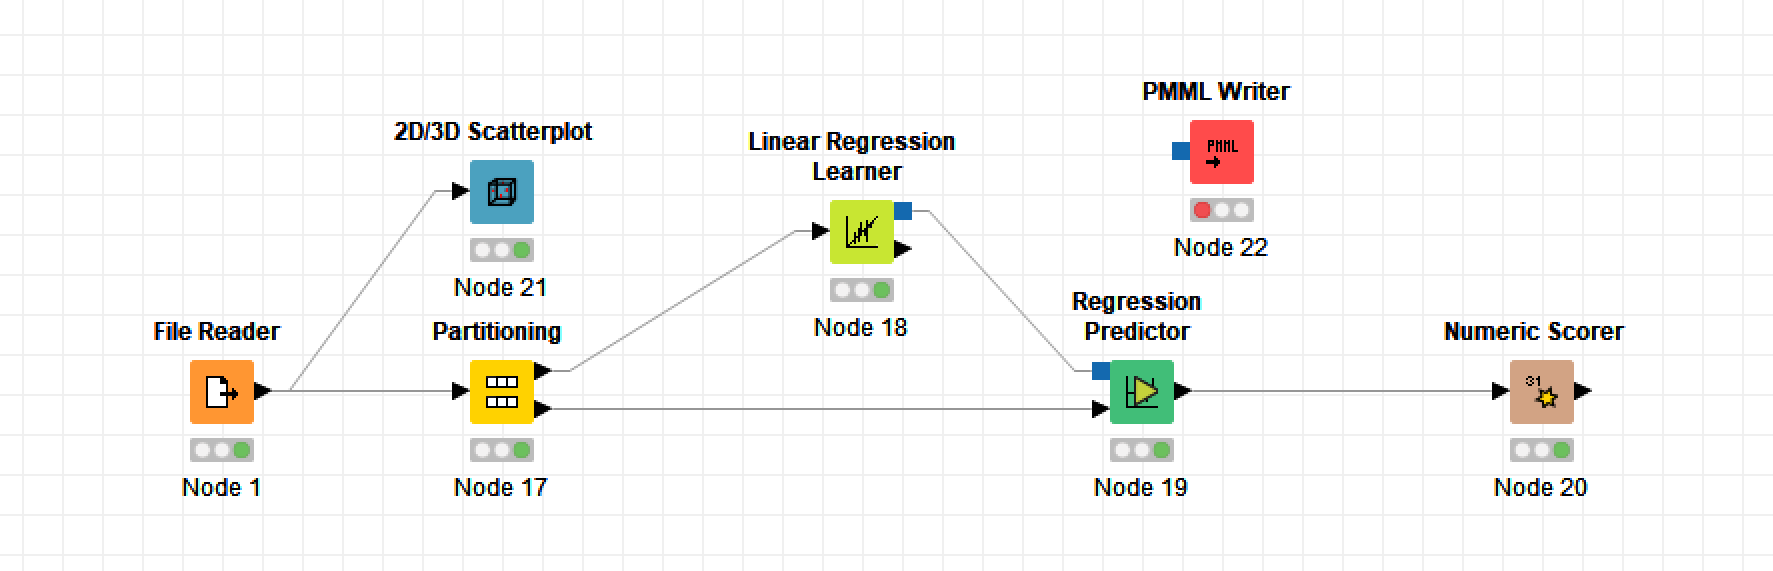
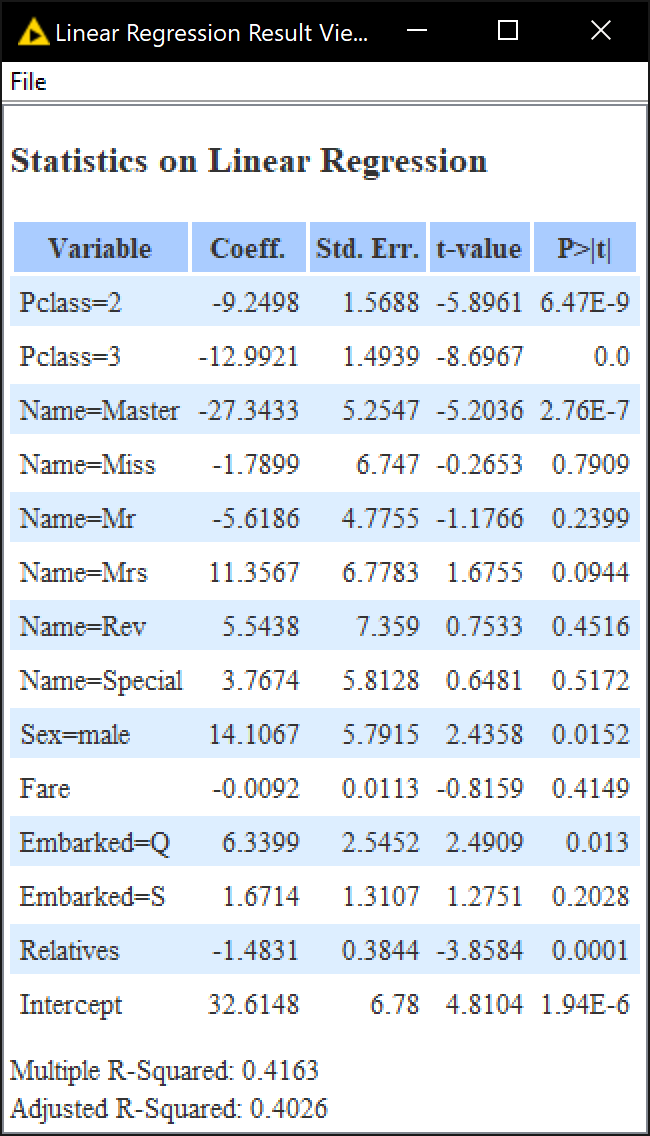
Want to predict Age missing values in Titanic Data Set with linear regression but it appears it is not working well as R^2 value is less than 0.5. Also it shows weird Result view, as multiple categorys in one variable are showed instead of just showing the statistic for that variable only.
Any idea how i can do this better? Thanks!
Hi Elucid_IV, welcome to the KNIME community!
In linear regression, categorical variables like ‘Name’ are converted into so-called dummy variables. It works like this: Initial table:
RowID Name Fare …
    1 Miss  100
    2 Mr     30
Converted table:
RowID Name=Miss Name=Mr Fare
    1         1       0  100
    2         0       1   30
and so on. Try the “One to Many” node to see what is done implicitly.
Kind regards
Agaunt
1 Like
Hi @Elucid_IV -
Is there a reason you would expect to be able to predict a continuous variable like age from this dataset with high accuracy? I would imagine there would be correlation between some variables (for example, older people might be expected to purchase nicer cabins, and probably were more likely to perish) but would that produce a very high R2? That seems unlikely.
Also, showing the p-values for multiple categories in a class is standard here when using a dummy variable approach. So KNIME isn’t really doing anything unusual in its display of results.
All in all, I don’t see anything strange about the results shown here.
(As an aside, most of the time I’ve seen the Titanic dataset in an example, what’s being predicted is whether passengers survived or not. This is a classification problem that tree algorithms tend to perform very well on.)
2 Likes
This topic was automatically closed 182 days after the last reply. New replies are no longer allowed.