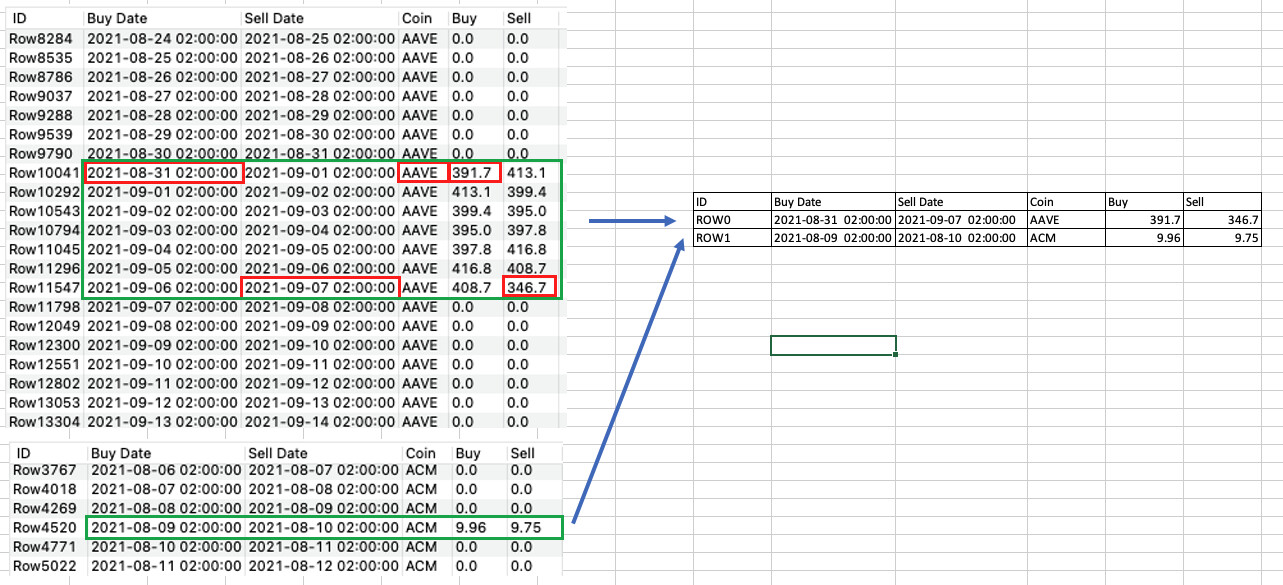
I have a table with columns Buy Date, End Date, Buy Prices and Sell Prices.
This is a continous time series. When the system is not invested all columns but dates are ZEROS.
What I need now is a Table where the phase (first buy date to last sell date) is one single row for every occurency.
The picture tells more than my (semi-good) english.
Would it be possible to share some (sample) data (e.g. the table above) in a KNIME flow or excel / csv format. That makes it easier for me (and I guess the rest of the community) to create a workflow that shows a way to answer your question.
gr. Hans
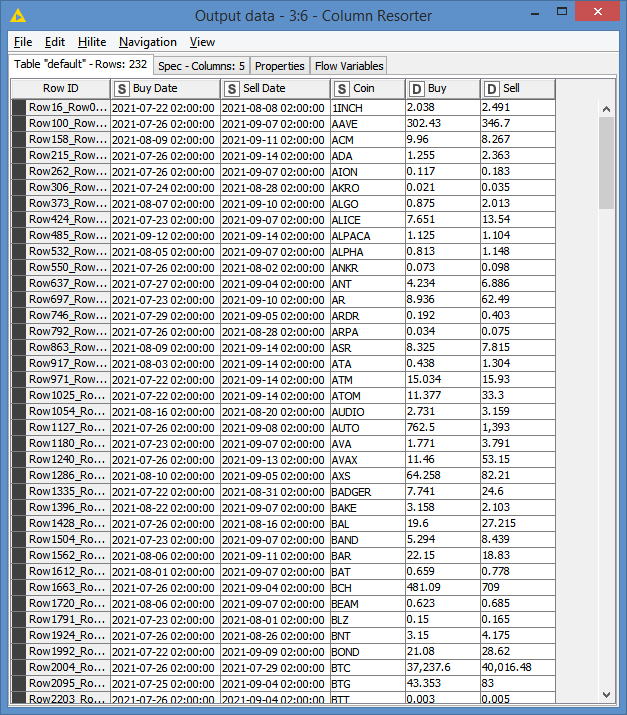
EDIT: Based on the data in your screenshot, your results are correct. However, in the real data, if you scroll up, you also have this entry for AAVE: 2021-07-26 02:00:00 2021-07-27 02:00:00 AAVE 302.43 299.94
So, that’s why in the calculated results, the Buy Date is 2021-07-26 02:00:00 and the value of Buy is 302.43.
That was just in case you were comparing my results with your results for AAVE. Similarly for ACM.
 )
)