I would like to be able to loop over two columns at a time and perform some analysis on each pair of columns (which would then be appended to create a final analysis file).
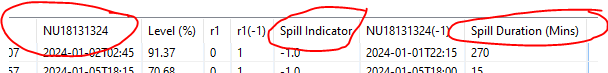
The dataset would be as follows (smaller extract provided due to size of file):
So the loop would look at columns A&B first, then C&D, E&F and each analysis step would add a flag of 1 if the Level (%) was greater than 100. For each pair of columns I would like the output file to take the header from the first column (i.e. from columns A, C, E) and sum the number of flags (I know the sum will be zeros based on the limited dataset).
Yes, this post helps, thanks for pointing me too it.
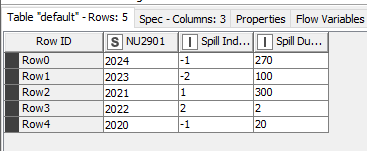
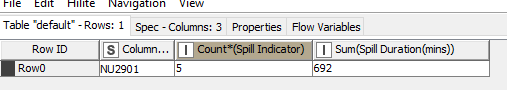
In terms of the output file. This is what I have (based on only the first two columns:
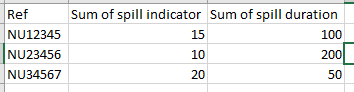
How could I produce another output table that take the NU ref (1st column header) as a row then has a sum of spill indicator column and a sum of spill duration - so it would look like this
PLR spill count total duration
NU18131324 91 114.75
Also, when I only have three sets of column pairs in the test data set, the “Loop End (Column Append)” node will execute. When I connect to the much larger source file which has 56 column pairs (112 columns in total), the “Loop End (Column Append)” will not execute. It just remains at the configured state.