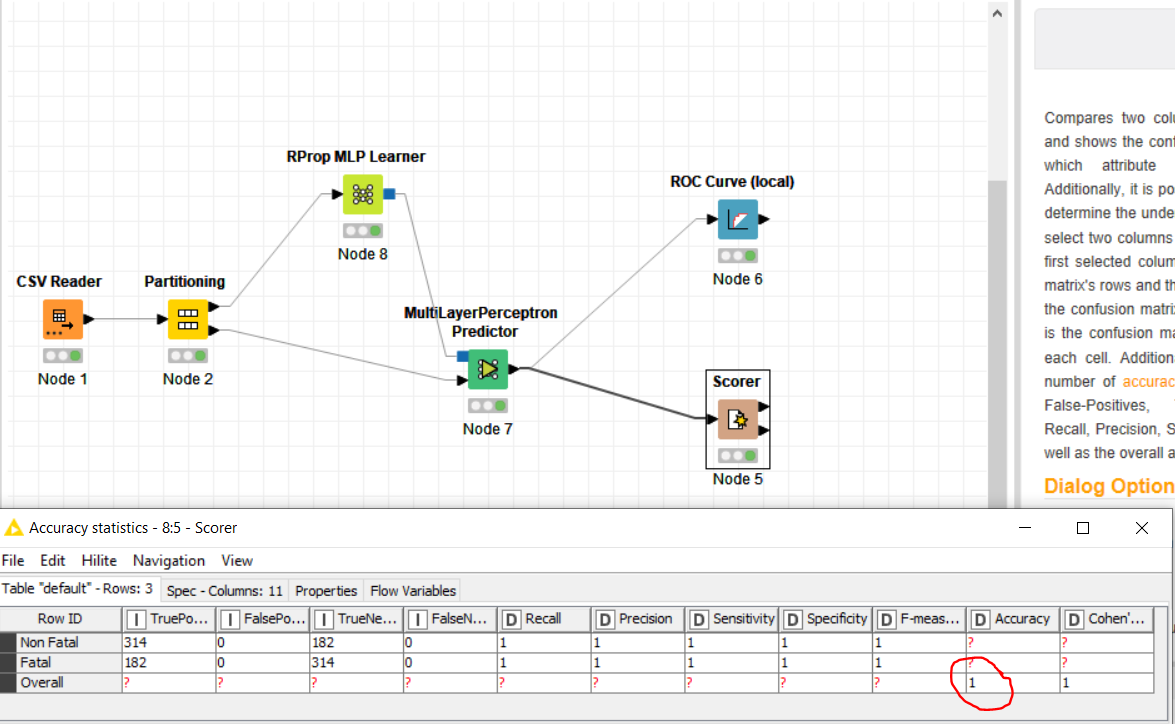
I am trying to find the best classification model for accidents crash data. I developed this network in KNIME, it gives an accuracy of 100% for different models I tried (like SVM, RF, MLP)
Please guide where I am making mistakes because 100% accuracy is rarely possible
You could see what variables mostly drive the results. It is possible that you have some sort of leak, where a variable different from the target would explain all of the results.
Maybe you try and get the variable importance (H2O.ai Random Forest learner has them) and see what variables have the most influence on your result.
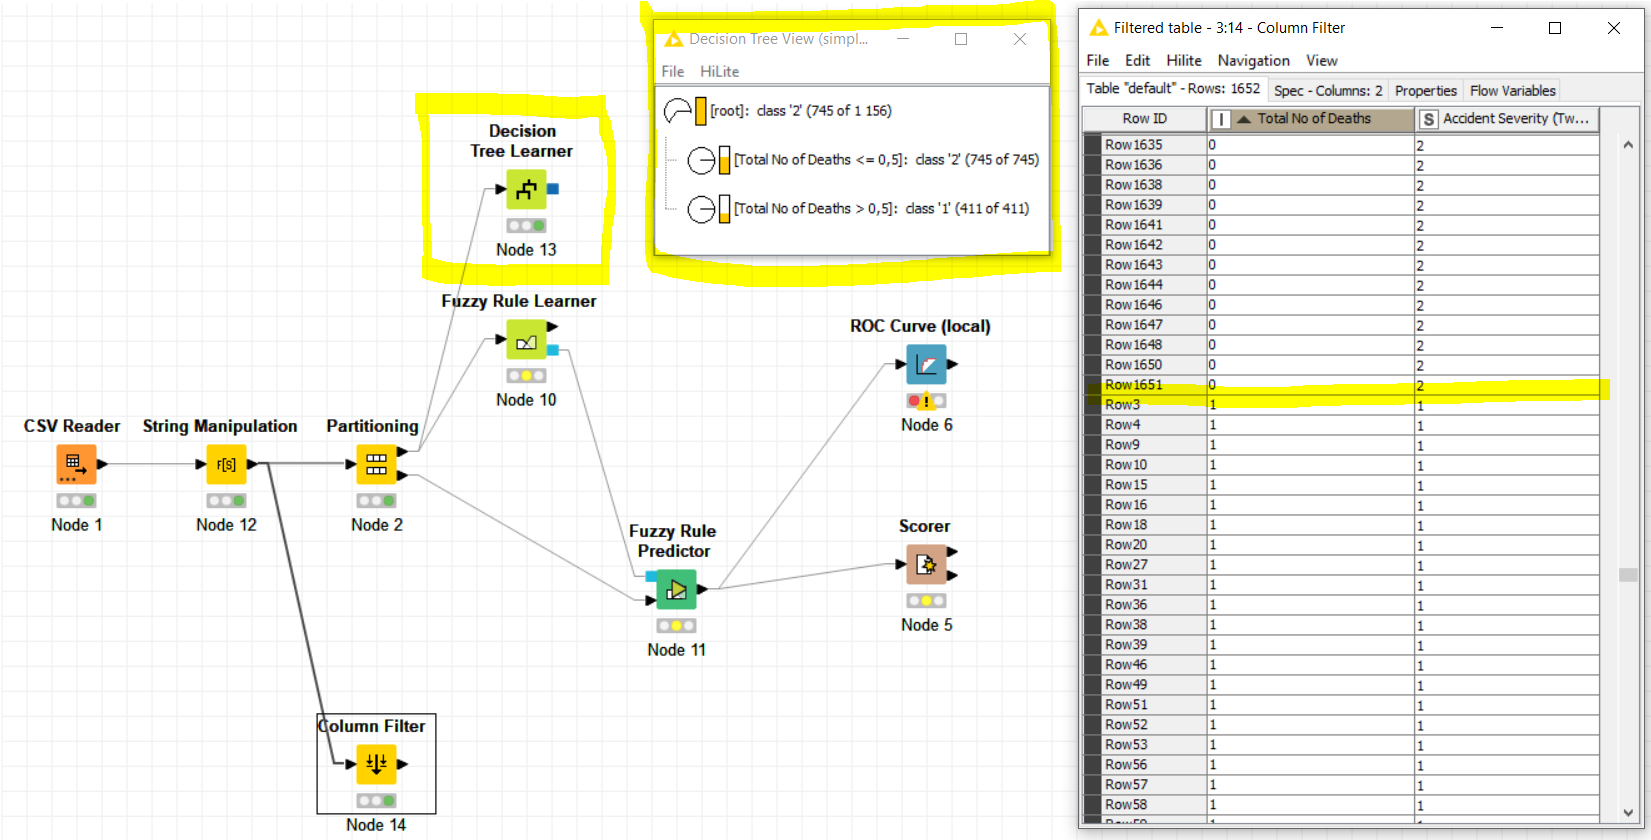
I had a look at your data and the column “Total Number of Deaths” exactly matches the column to predict “Accident Severity (Two Classes)” (with different constant values but this doesn’t matter). This is why you get 100% Accuracy.
An easy way to check for this kind of problems (among others s.a. correlation between variables) is to train a Decision Tree Learner and look at the first branch of the Decision Tree obtained after training, as showed in the snapshot below:
The workflow is almost the same as the one you uploaded. I had just added the -Decision Tree- node and a -String Manipulation- node to convert the “Accident Severity (Two Classes)” variable to a nominal one.
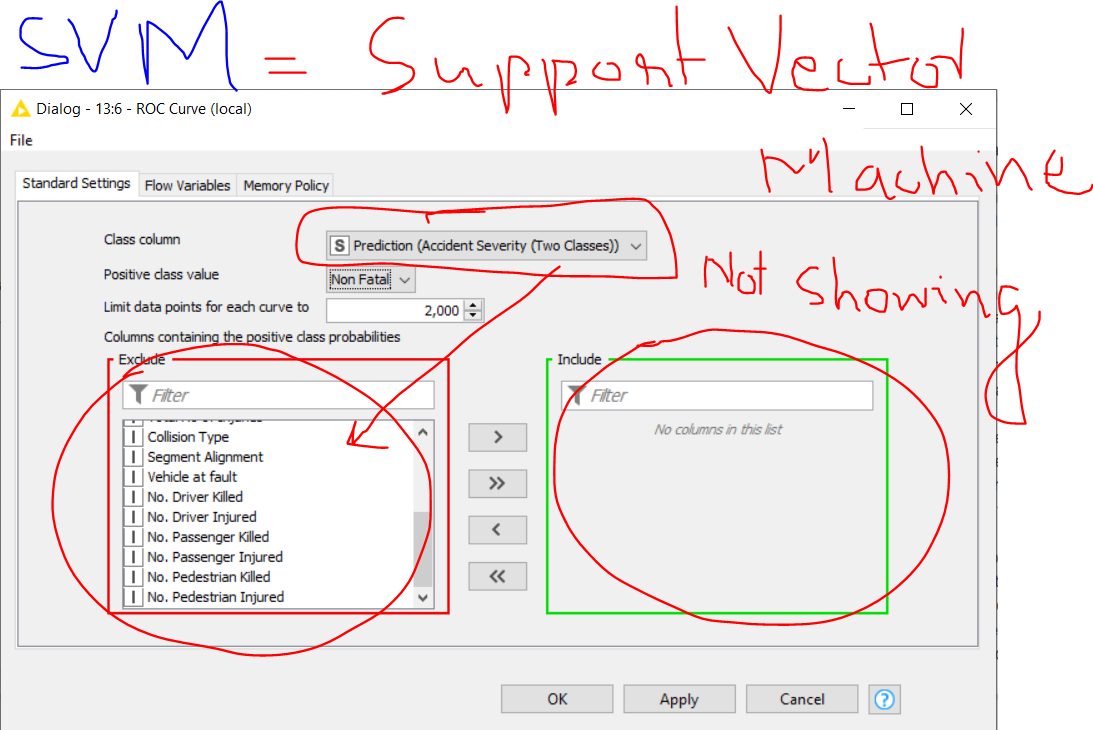
When I try to plot ROC Curve for Random Forest (RF) classification it gives me proper targeted variables to include and plot ROC
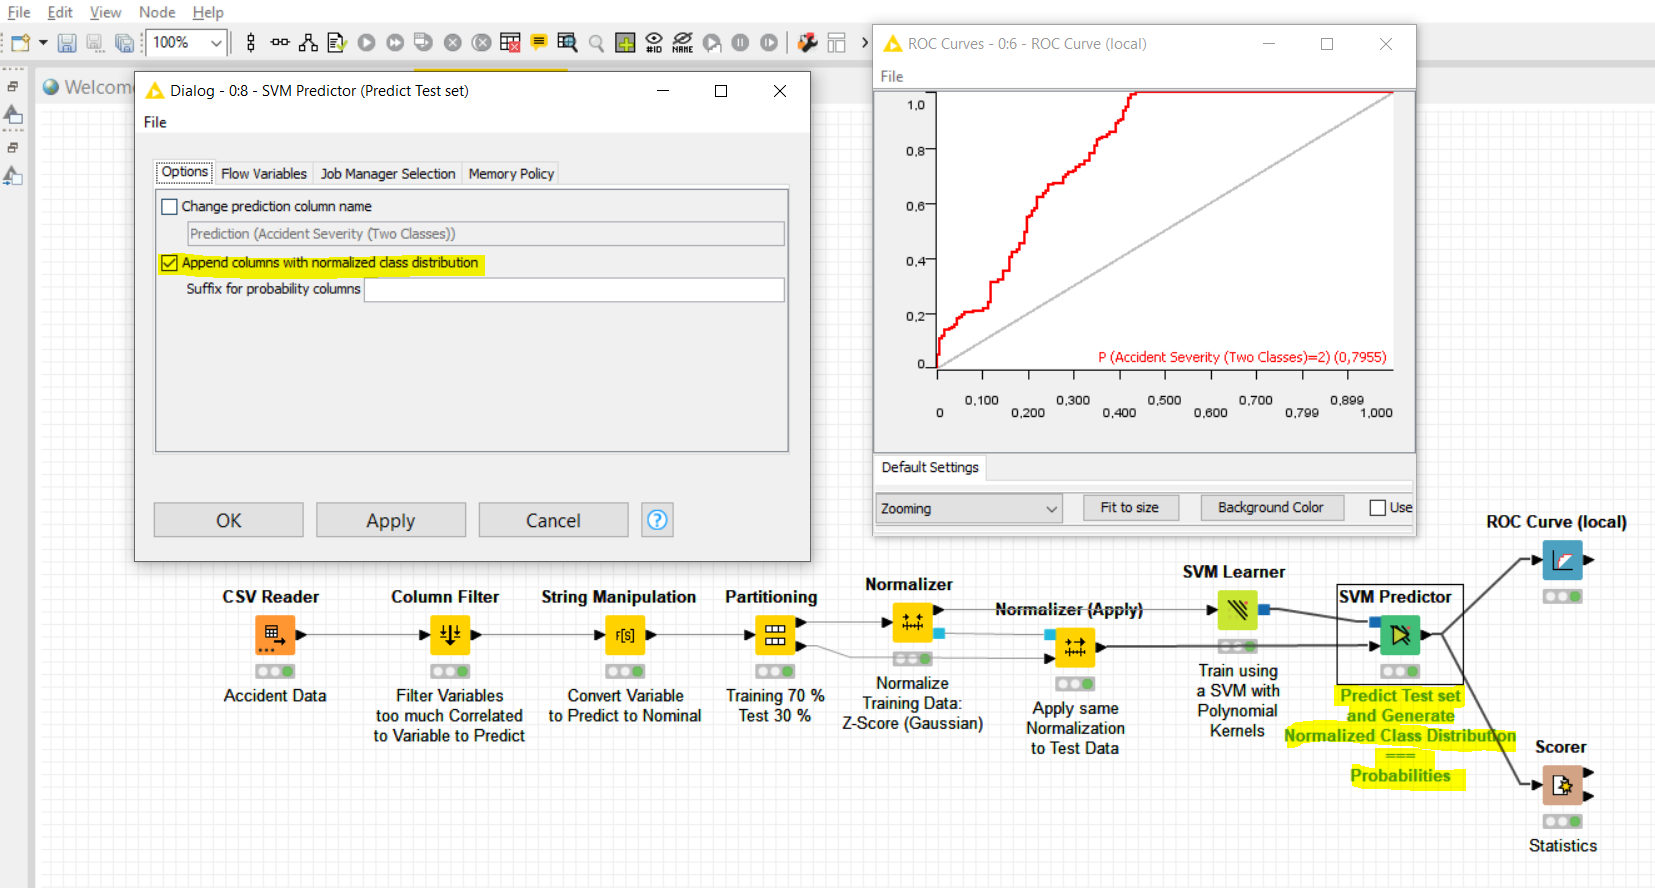
but incase of SVM (support vector machine) this (prediction(Accident severity “two classes”) is not shown in left side column to include in Right side column and plot ROC?
Please, what is the procedure or alternative for drawing ROC if we use a classification model other than RF because I need to compare different models like RF, SVM, LR, ANN, etc and select the model with the best prediction and accuracy
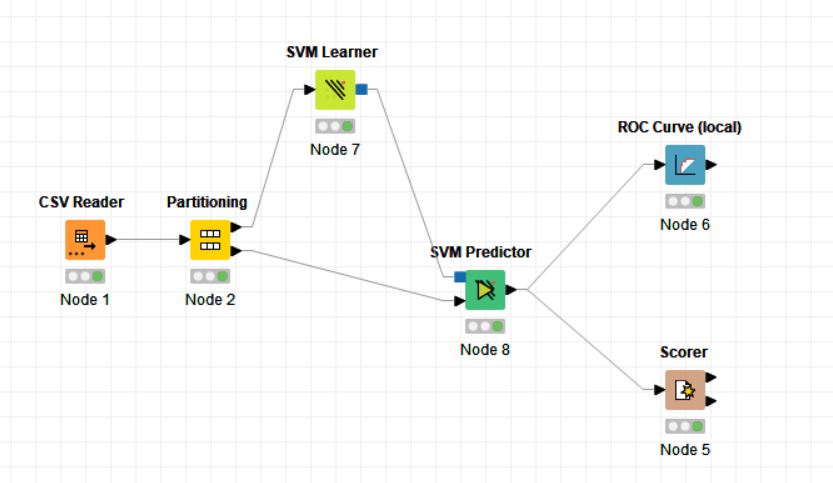
I had a look at the SVM Predictor configuration and there is an option that you need to check to generate the probabilities of every class. I have modified the workflow in this sense to be able to generate the ROC curves. I have also added the normalization of variables since this is something recommended to be done when working with an SVM model. The workflow now is as follows:
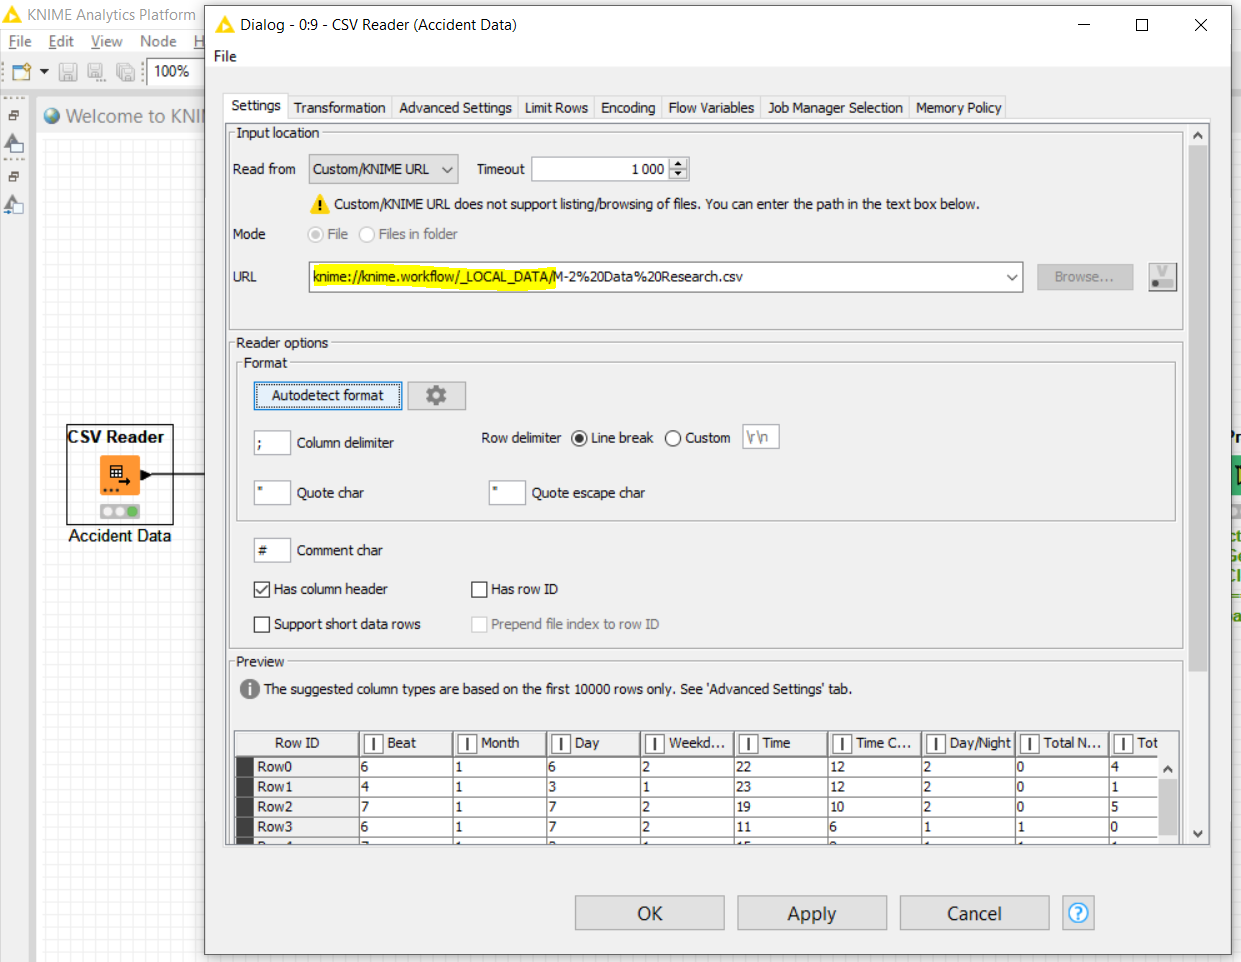
Please be aware that you can store the data in the workflow and upload it here with the workflow already executed. This makes easier the execution of your workflow. I have hence created a folder called “_LOCAL_DATA” inside the workflow and put your file inside. The way you call this file in the -CSV Reader- node is as follows:
The URL should start with “knime://knime.workflow/_LOCAL_DATA/” to indicate that the data is under the local folder “_LOCAL_DATA”.
With respect to your question:
Not all the machine learning models generate probabilities associated to the classes and how they do it is dependent on the ML algorithm. You’ll find this probability information in most of the ML ensemble models based on Trees. You can also get it from ANNs. The way you get this information, when available, will differ between methods.