Making Use of Polygon Boundaries Data

Dear KNIMErs, let’s say I have an irregular polygon like this, I would like to:

  1. Calculate the number of fixed-sized circles I need to draw on the map to cover as much area as possible. Since my circle area size is fixed at 1963.5 square miles, I think I can formulate it like this:

No. of circles needed = Total area of polygon (in square miles) / 1963.5 square miles

If this formulation makes sense, I will then need to calculate the total area of polygon. Is this possible if I have the list of coordinates of the polygon boundary?

  1. Assuming someone helps me solve the above problem (1), my second question is, is there any way to find the optimal positioning of those fixed-sized circles within the polygon, such that they cover as much area as possible?

Many thanks!

Hi @badger101 , before getting your hopes up, fully disclosure… I have no idea… :wink: , but what I do have is a number of thoughts and questions…

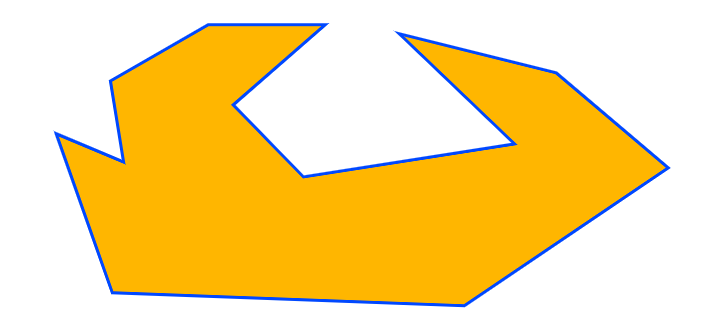
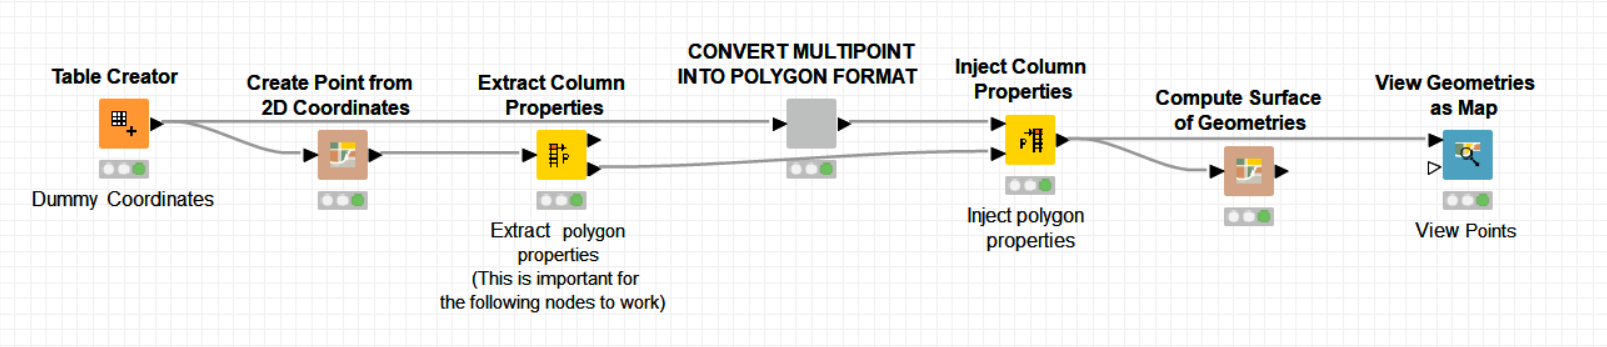
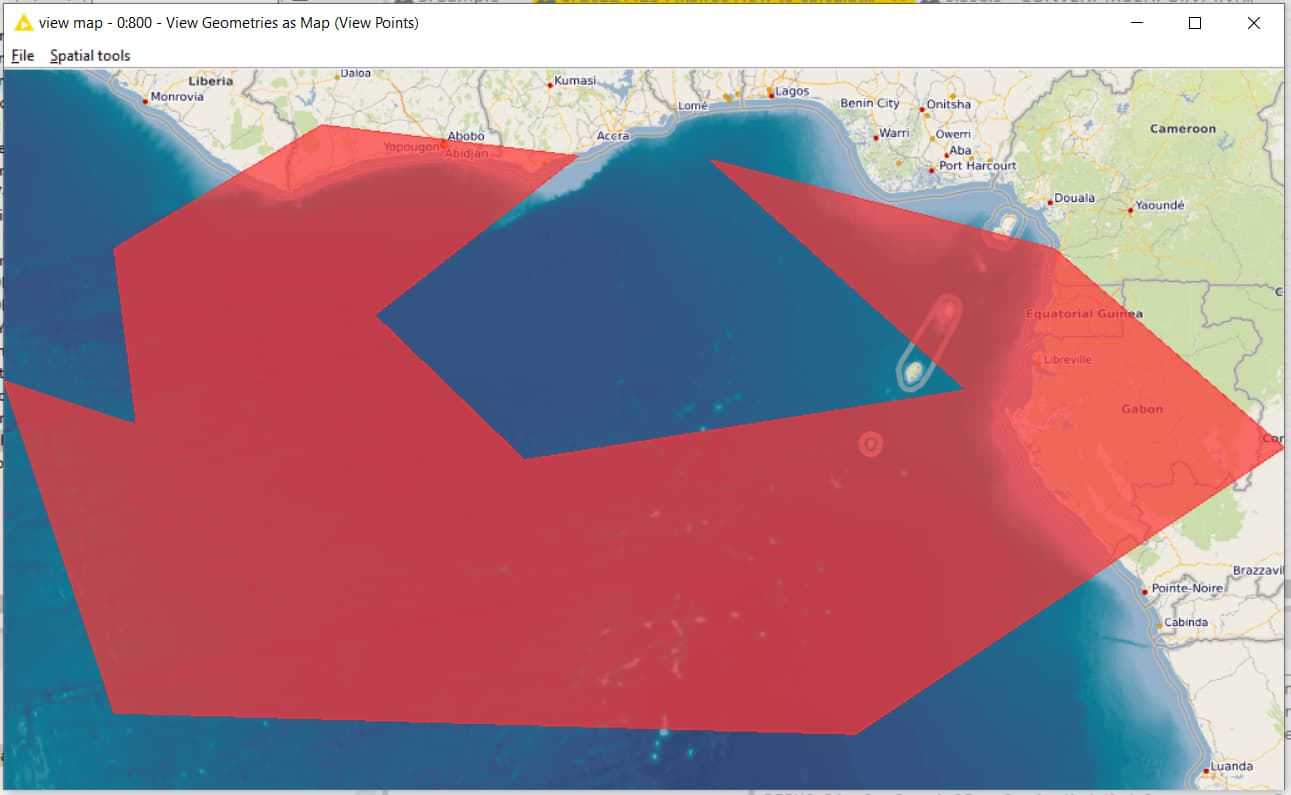
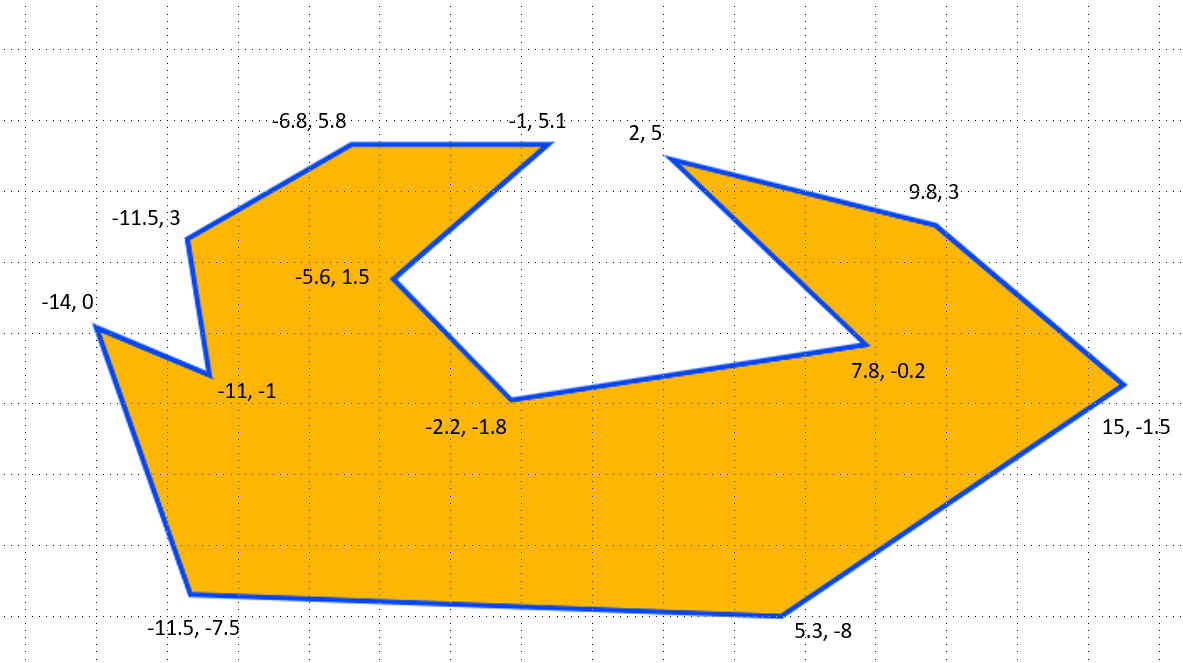
Firstly, I suspect that the answer to finding the area of the polygon from its coordinates is the easier part of the challenge, and some searching would suggest that the solution would likely come from some python packages, unless it turns out somebody has a KNIME node that can already do it. So I presume that your data would be presented in the form of a table of coordinates which could then be fired at a python script and out would pop the “area” answer.

I found the following page interesting on the question of calculating the area based on coordinates, though I have not tried the suggestions.

I’ll assume for the moment that python is an available option, so that part of the challenge could be covered there.

My bigger question concerns your first point

and whether, as you ask, the formula makes sense.

I think to answer that question, we’d need to know some “rules”.
For example:

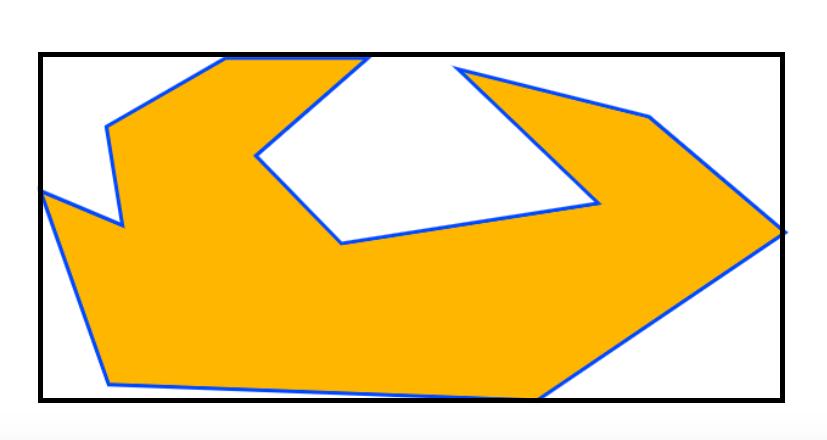
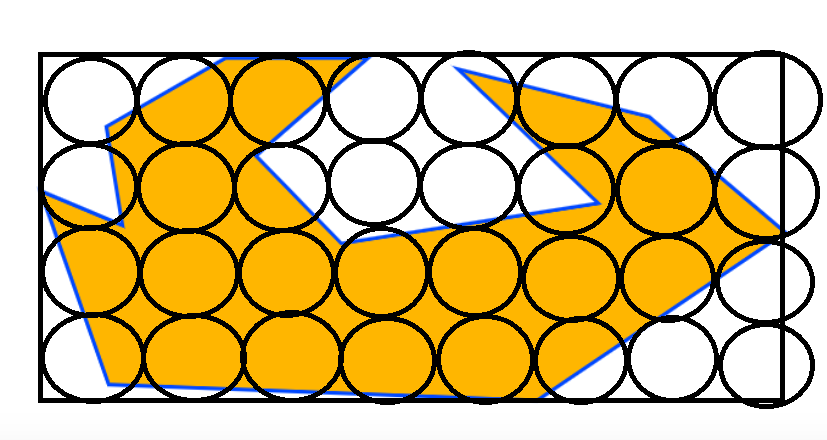
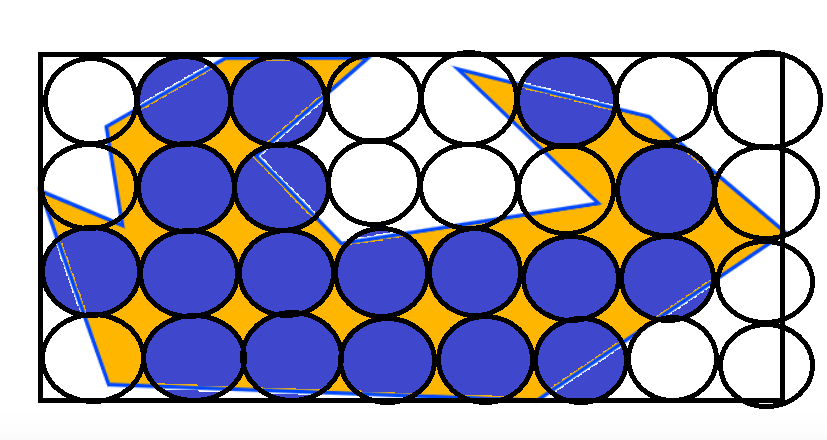
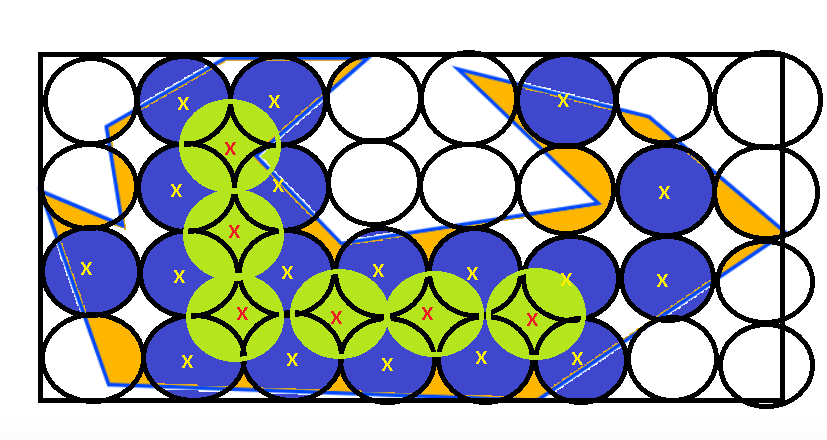
  • Are you looking for circles which would be completely inside the polygon?
  • Does the centre of a circle have to be inside the polygon?
  • May circles overlap each other? (since the only way circles can cover an entire area is by overlapping)

My assumption, from the way you have written the question is that the answers to the above questions are:

  • Yes
  • Yes (by extension from previous “Yes”)
  • No

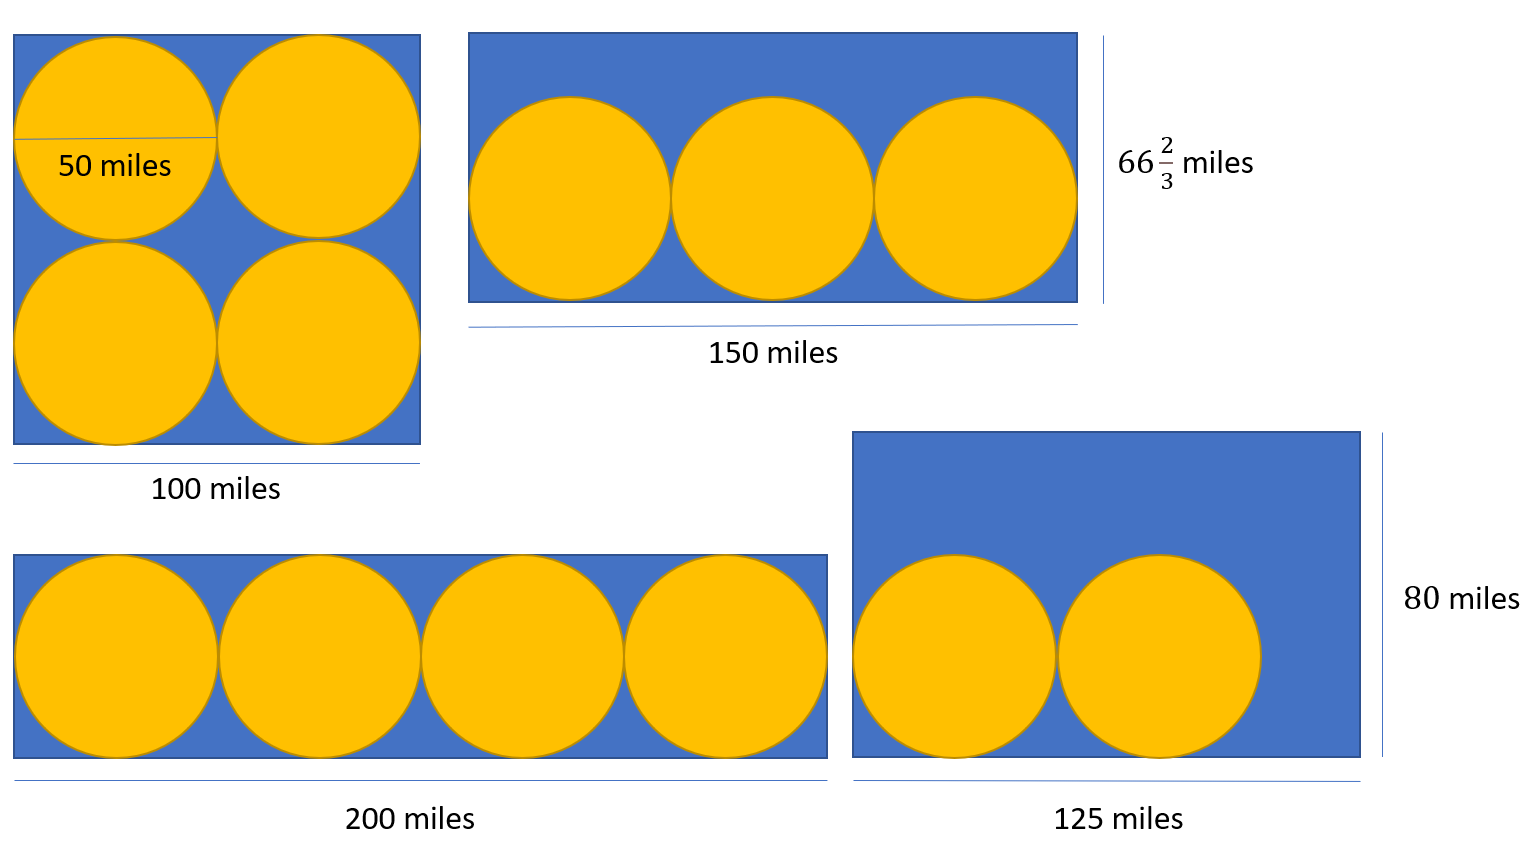
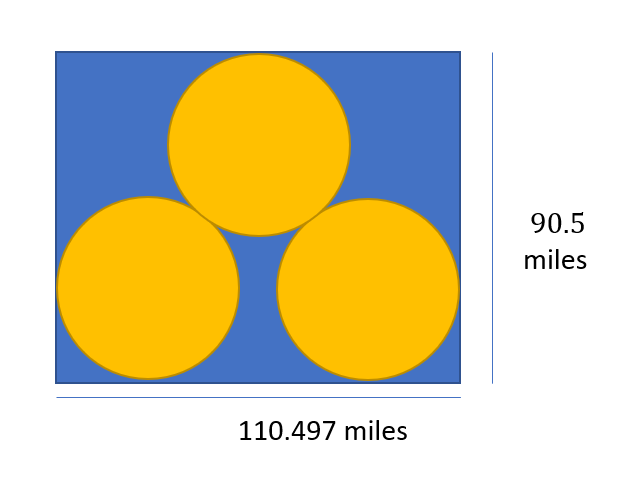
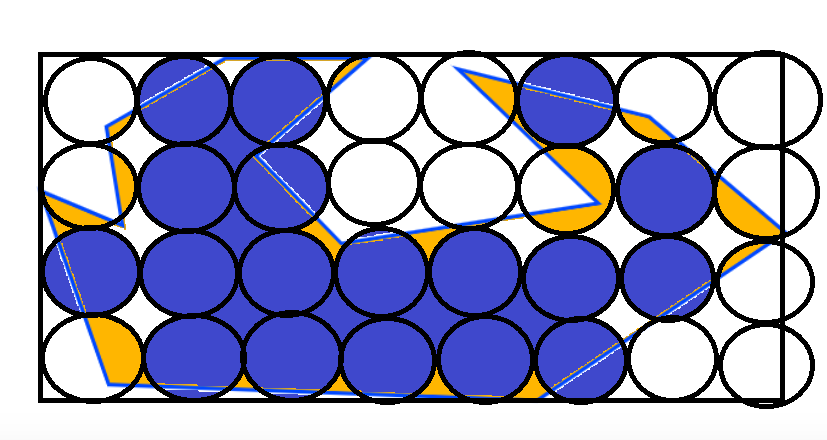
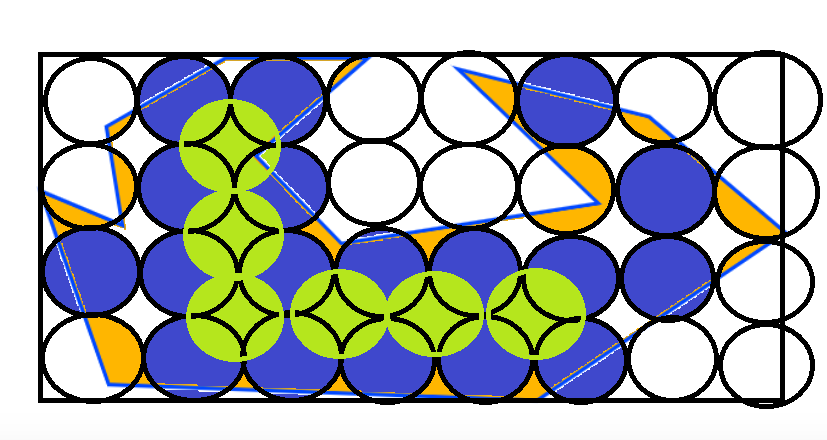
Intuitively I would say that the quoted formula for number of circles needed doesn’t work as a generalised formula simply because it would surely be dependant on the relative proportions of the polygon and its dimensions compared with the circle.

This would be most apparent if we look at regular polygons. If you took the example of a square which has its sides matching twice the diameter of one of your circles, the solution would probably be four circles. And here your formula would work.

However, if the polygon were rectangular, with the same area, then the formula would work only in a specific case, and not work in other cases, e.g. for your 1963.5 sq mile circles… inside polygons of 10,000 sq miles, this could be four in the optimal case, or three, two, or potentially zero circles contained as the length to height ratio of the rectangle changes

2 Likes

(Oops…I just took a moment to reread what I wrote and in fact in my example of course the formula never works because the area lost in the gaps between circles is probably at least the area of another circle… ie 10k divided by just under 2k should be 5 circles but only 4 can fit even in optimal circumstances) Additonally, there will be the challenge that a different positioning of circles under some circumstances can yield better results:

image

I think this calc is right, but forgive me if I haven’t quite done my sums correctly! :slight_smile:

2 Likes

Hi @takbb , those are great questions. It made me rethink the way I approach this thing. What do you think of this new train of thought I have? (see below)

Step 1:
Find a way to draw a rectangle that covers the irregular polygon in its entirety.

(The challenge for Step 1 that I can foresee would be on how to determine which vertices to pick programmatically. Right?)

Step 2:


Fill in the imaginary rectangle with the fixed-sized circles that are non-overlapping.
(The challenge for Step 2 is to see if the way we distribute the circles affect the final outcome. In the case I’ve shown here, I have drawn the circles starting from the top left section to the bottom, then repeating it to the next column until the rectangle is filled. Will it have any difference if we are to start drawing from the center of the rectangle instead, and draw the next circles, no pun intended, around the first circle in a circular motion?)

Step 3:
Pick only the circles whose area covered is at least half. Here it’s depicted by the blue color.

Step 4:
Detect all landlocked regions between four blue circles:

Step 5:
Draw another layer of circles to represent those landlocked regions in Step 4 (depicted here in green)

Step 6:
Mark the point radii (or radiuses, whichever linguistic term you subscribe to) of all blue and green circles.

So, from this irregular polygons, the 24 point radial coordinates are the one I want.

I am looking to find the representative coordinates for a given region on the world map with optimal coverage of the area under study.

. . .

I would appreciate a non-python solution. The only coding skills I have lie in R, and it’s the most basic knowledge one could have, but even so, I have never really truly practiced R, let alone tried it in Knime. I hope to find a solution with native codes + javascript node + any relevant coordinate and mapping nodes from the community extensions, with R as the final option for me, but only if it’s super necessary.

Thank you so much for having given this a thought @takbb . If python is the only way, I’m afraid I can’t proceed further. :sweat_smile:

The funny thing about all this is that the only data I have is the boundary coordinates of the polygon. And that’s it.

2 Likes

@badger101 , with regard to your step 1, programmatically, if you have a series of (X,Y) coordinates, then wouldn’t the bounding rectangle simply be:

(Xmin, Ymin), (Xmin, Ymax), (Xmax, Ymax), (Xmax, Ymin)

1 Like

Yes that sounds about right! :grin: :grin:

@badger101

You may have more success with the GIS (Graphical Information Systems) communities. I would take a quick look at QGIS to see if it has anything that would do what you require. Topics you may want it look at are Voronoi diagrams (identifying minimum number of links between circle centroids) and then using force directed graph drawing algorithms to move the circle centroids to optimise their placement. This would require some programming, but may be possible with QGIS/Cytoscape combination.

Another approach that might work is to fill the polygon with a large number of regularly spaced points and then use a k-medoids clustering algorithm to cluster the points. The algorithm would seek to minimise the x, y co-ordinate distances (euclidean distance). The centre of the medoid would be the centre of your circle. You would need to adjust the target number of clusters to ensure coverage, but it should distribute the clusters across the polygon to minimise the number of clusters needed to cover the shape.

You can do this in KNIME.

It’s a rough idea, but may give you something to work with.

DiaAzul

2 Likes

Hi @DiaAzul , that sounds wonderful ! May I know which specific extension are you referring to?

@badger101

K-medoids is part of the base KNIME package > Analytics > Mining > Clustering > k-medoids

You may also want the KNIME Data Generation nodes to generate the points. These nodes are useful for generating synthetic / sample data.

DiaAzul

1 Like

Ahh I understand now that the first approach you talked about is a non-Knime approach right?

And the second one is the one for Knime? Is there any sample workflow in the hub that uses the k-medoids for such purpose, that you know of? (just so that I have a lil bit of reference to start with)

Sorry, I don’t use the hub (or the new-fangled javascript interface).

You can look at the following workflow:

The important aspect in that workflow is the Silhouette coefficient which is a measure of clustering quality. You can read more on the Wikipedia article . What you would need to do is create a workflow that seeks to identify the cluster number that generates the best Silhouette cluster value.If you run the loop over a range of values and then plot the results you can estimate the best value (state with a wide range and large step size for target cluster numbers, plot the results and then refine the search).

DiaAzul

I’m familiar with using Silhouette to evaluate clusters. But I can’t visualize how to use coordinates data to do the clustering in the first place. :grin: Are we talking about two columns of double values representing lats and longs, which are to be fed to the k-medoids node?

Bear in mind that I don’t know how to find the coordinates inside the polygon itself, nor do I have the data for it. :sweat_smile:

@badger101

To evaluate co-ordinates within the polygon there are a few nodes in the KNIME Shaprefile Support package.

Specifically, Shapefile polygon reader, Shaprefile point reader and Co-ordinate row filter. The co-ordinate row filter filters points within a polygon (which does what you require).

Though, you may find it easer to download QGIS. This will allow you to create a polygon, create the grid of points and then select the points within the polygon. You can then export the selected points to KNIME and do your optimisation.

It’s a bit clunky, but should avoid the need for Python programming.

DiaAzul

2 Likes

Thanks so much, will definitely look into that extension later today!

(I find it peculiar that it comes with 2 different names in the hub - ESRI and Shapefile)

@badger101

ESRI is the company that created ArcGIS software and spawned the Shapefile format which is now an industry standard.

2 Likes

Hi @badger101

Complementary to the previous posts by @gonhaddock, @takbb & @DiaAzul, please find a workflow that implements the calculation of the surface of a geometry (area of a polygon based on spatial coordinates), based on the EIFER plugin:

Unfortunately, there are too very few workflows in KNIME that use this plugin and hence it is not straightforward to understand how they work. This is what one gets eventually when simulating the shape of the polygon you are showing:

from the dummy coordinates I guessed from your polygon, as follows:

Obviously the geometric surface of the polygon depends on the scaling of the coordinates you are using. I were using dummy coordinates that look like yours but your real ones might give the real polygon area based on the -Compute Surface of the Geometries- node.

Hope all this helps to progress further in your research of a solution :wink:

Best
Ael

4 Likes

Hello @badger101
I saw this post but I hadn’t the chance to answer up to now. Just a couple of comments adding to the info already provided by @takbb and @DiaAzul. I agree that my first approach would be based in Py but I think that the R approach is also possible, and not too complicate with the right logical approach.

This is an interesting challenge; It would be nice to have some more info about whether if this is just a geometrical problem or it has a real word physical analog. I say this because if you are looking for some kind of drainage efficiency, or an fire extinguish system would be even logical to get some circle overlapping.

In the geometrical sense and applying some physical logic, your sketches would represent the horizontal section of a compact cubic solid, this is -some crystallography concepts- how the atoms interconnect, four tangent circles whose connected centers shape in a square. But the most compact physical solid is the compact hexagonal like a diamond, the atoms connect forming tetrahedra. Taking a horizontal section it is represented with three tangent circles whose centers connect in an equilateral triangle. Your landlock area will be smaller!

All this is relevant for the coding approach… the first step is to decide the type of netting if hexagonal or cubic based on the radius, to be extended over an area largely exceeding the limits of the polygon.

Then make a ‘x-y’ data frame and compute $area_inside$ and $area_outside$ for all the objects; with a logical indexing if inside area is == to full area, you can easily filter excluding those that are out of the polygon or not fully inside…

For your second question:

Once you end with all the computing, the difference of the polygon area vs the sum of all the true circles is the parameter that you will have to iterate over, by moving your netting in steps. The final result is a 3D netting (step x, step y, area difference).

The minimum differential_area value of the function enveloping the 3D calculated net, it is the optimal position for your circle netting.

BR

PS.- You would add a 4 dimension, by iterating again the previous minimum results vs the angle of the netting.

2 Likes

@aworker Thank you so much! That suits the initial approach I was using. I’m sure the workflow you shared will perform the area calculation job as you described. However, as you can see from the dialogues between me and @takbb above, there are other decisions involved such as overlapping versus non-overlapping. I don’t think my initial approach is viable anymore, because there is no anchor of reference as to where to properly position the circles. Having said that, if I am faced with a task to calculate the area within a polygon in the future, your workflow will be the first one I’ll go to! Really appreciate the effort!

@gonhaddock To your question, the reason why I wanted to get the representative coordinates for a given region with optimal coverage area is not in your thought list, and it’s way simpler than what you mentioned. The bottomline is that if the coverage area is as good as the figures I had drawn in the earlier post, it’s good enough. I understand what you are trying to propose, because before I wrote this post, I’ve already googled this kind of question, and I found so many people asking for the same thing, but all of the answers are for coders and I don’t understand the jargons behind them, which is the same thing with yours, unfortunately. I remember one of the answers I’ve found was something regarding honeycomb lattices. It gives the right visual in my mind, since it solves the landlock issue, but again, I don’t understand the jargons behind them. The only thing that will make me understand is by reverse engineering a Knime workflow that applies those jargony concepts, and do my research/reading from there, provided that the workflow is well annotated.

Hope that makes sense? :sweat_smile:

By the way, I still haven’t got the chance to visit the proposal from @DiaAzul , since I am a little bit preoccupied at the moment with other things. Plus, the area I’m living in is having problems with water supply, ironically it’s not because we have scarcity of water, but it’s because of the excessive rain we got that muddles the water in the municipal water facility. It does get on my nerve that nobody’s solving the issue systematically. :rage: (sorry for the rant)

1 Like

@badger101

I’ve now had a chance to test out the approach that I set out above using clustering to identify the location of circles within an irregular polygon. Surprisingly, it worked. I also found a plug-in within QGIS that will allow you to do that clustering within the QGIS package, however, for the purposes of the KNIME forum I will use KNIME to do the clustering on the basis that you might want to avoid using QGIS. (the QGIS clustering project is installable using the plugins manger and is called **

Step One - Generate points

I used QGIS to generate random points within my polygon (in this case the county boundary).
Vector → Research Tools → Random Points Inside Polygon. In this case I created 10,000 points. In retrospect may be too many, though it is a balance between accuracy and speed.

Process in KNIME

I then exported the points from QGIS and imported them into KNIME using Spacial Processing tools. The workflow is in the hub if you want to download it (I’ve also included the data).

The workflow extracts the X/Y co-ordinates then uses K-medoids to identify the best distribution of cicles. The top branch of the workflow takes the radius of the circle and uses it to give a rough estimate for the number of circles required to cover the polygon - though you will need to manually optimise this manually. The data is then re-exported as a shapefile.

Post-processing in QGIS

The output file with geometries was then re-imported into QGIS. The points were buffered with the radius of the circle and plotted.

The Pure KNIME Approach

Whilst the QGIS/KNIME combination is my preferred approach (QGIS is far better for visualising results and it took about 30 minutes in total including creating the KNIME workflow). I have also created a pure KNIME approach.

This reads the polygon data from a shapefile. Note, the Spacial Processing nodes are a nightmare and not bug free. I had a lot of trouble with Co-ordinate Reference Systems which is why I switched from EPSG:27700 to EPSG:4326. The workflow generates a regular grid of points (first component). The component has a config option to set the target number of points in the rectangular grid. This is the filtered by the original Polygon (Relate Geometries). Note, relate geometries needs to input tables with equal number of rows, which is why the polygon is copied across the same number of rows as the points.

The points are then used to estimate the number of clusters. The second component has a config to define the radius of the circles. The radius needs to be defined in the same dimensions as the Co-ordinate Reference System (so in this case degrees) - this is why EPSG:27700 was useful (but didn’t work) because the dimensions are metres (yay!).

The points are then clustered. The points are buffered and both points and buffers plotted.

Final results:

Hope that helps
DiaAzul

5 Likes

Hi again @DiaAzul ,

Thank you so much for taking the time to provide not only one, but two workarounds for this challenge.

I’m in the process of testing the second method (as you’d expect).

The issue I’m facing is that the row number doesn’t match, even though I set the component setting to the same number of rows as the input file.

Here’s the workflow I’m using, with the Shapefile already uploaded inside, for you to have a look at what went wrong.

Clustering From Polygon(2).knwf (613.4 KB)

Secondly, I noticed that one of the nodes downstream is a Table View from Knime Views - Labs. I dont have the extension installed, is there any particular reason you didn’t use the normal Table View (from Knime Javascript Views Extension)? Is it possible for me to use the normal Table View instead? If so, can you either:

i) share a screenshot of how you configure the Table View (Knime Views - Labs), so I can replicate the configuration to my normal Table View
ii) or alternatively, can you replace that with the normal Table View in this workflow for me, with the proper configuration?

Thank you!