I’ve now had a chance to test out the approach that I set out above using clustering to identify the location of circles within an irregular polygon. Surprisingly, it worked. I also found a plug-in within QGIS that will allow you to do that clustering within the QGIS package, however, for the purposes of the KNIME forum I will use KNIME to do the clustering on the basis that you might want to avoid using QGIS. (the QGIS clustering project is installable using the plugins manger and is called **
Step One - Generate points
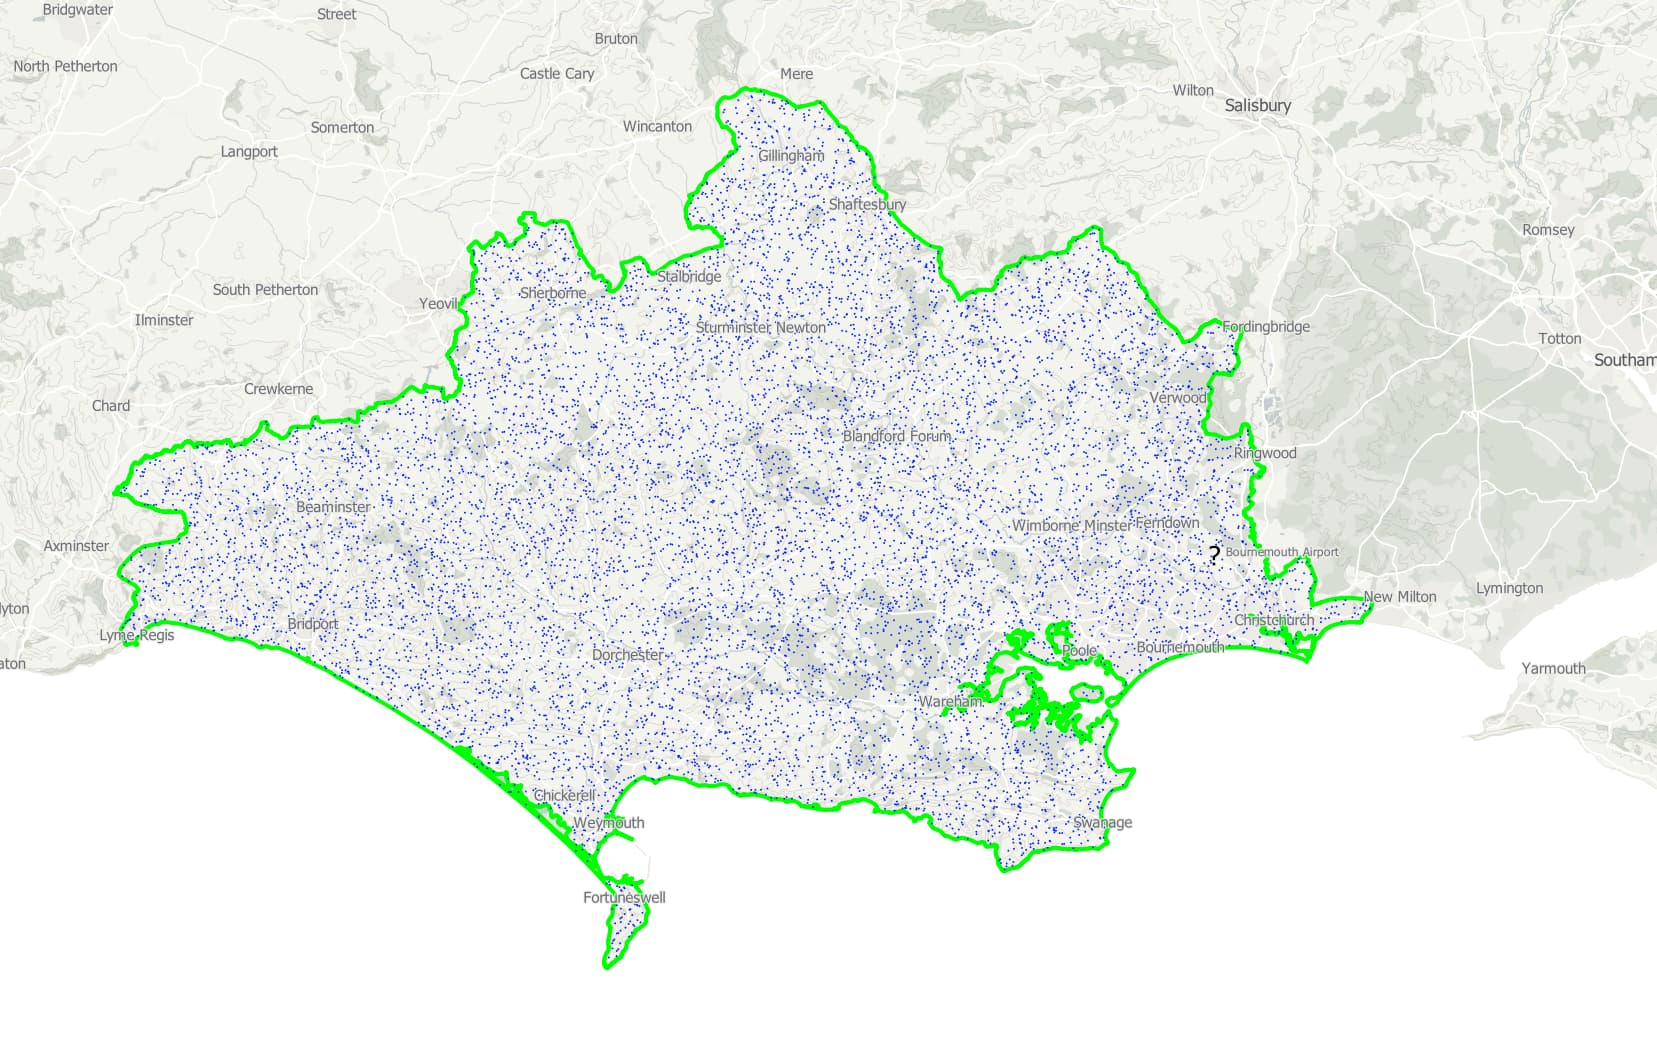
I used QGIS to generate random points within my polygon (in this case the county boundary).
Vector → Research Tools → Random Points Inside Polygon. In this case I created 10,000 points. In retrospect may be too many, though it is a balance between accuracy and speed.
Process in KNIME
I then exported the points from QGIS and imported them into KNIME using Spacial Processing tools. The workflow is in the hub if you want to download it (I’ve also included the data).
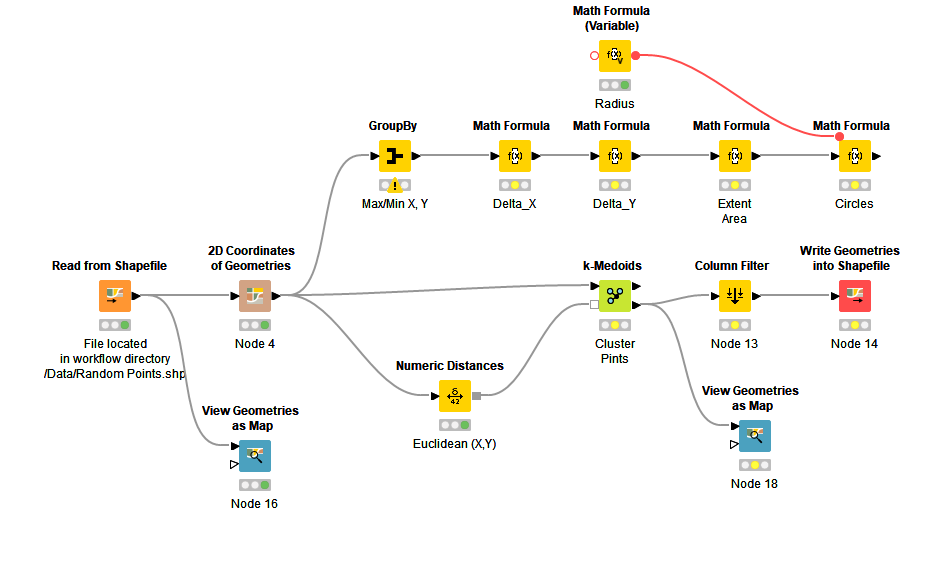
The workflow extracts the X/Y co-ordinates then uses K-medoids to identify the best distribution of cicles. The top branch of the workflow takes the radius of the circle and uses it to give a rough estimate for the number of circles required to cover the polygon - though you will need to manually optimise this manually. The data is then re-exported as a shapefile.
Post-processing in QGIS
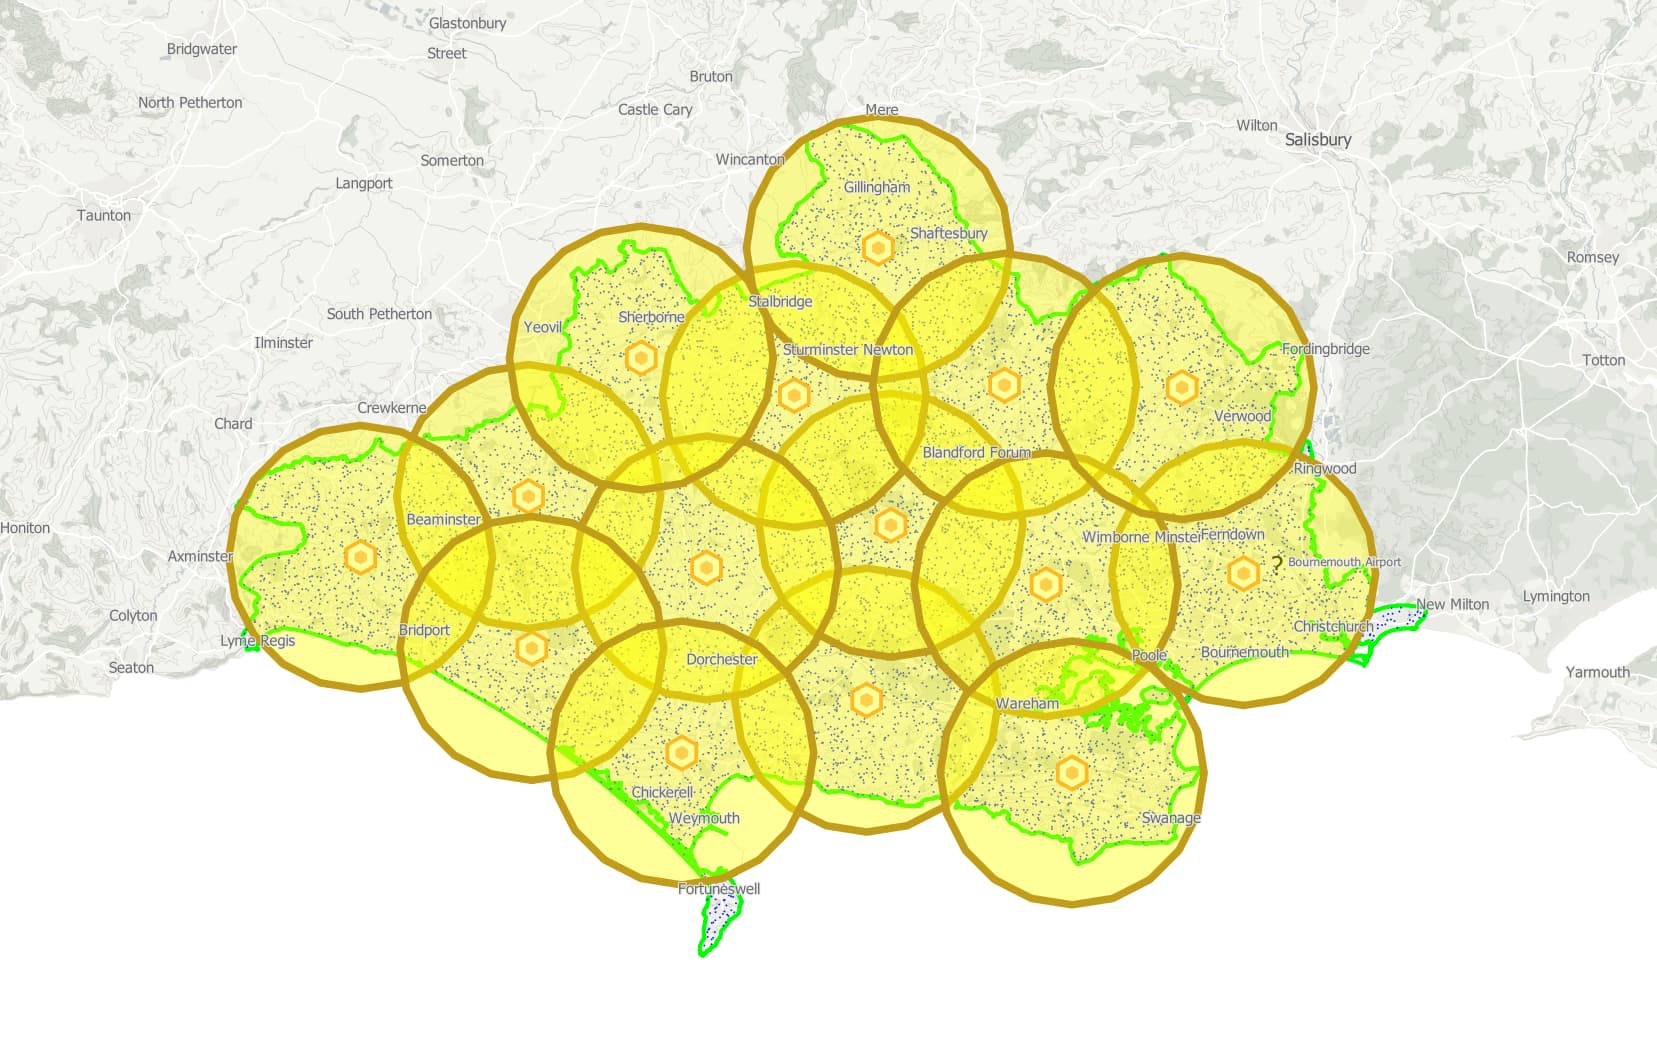
The output file with geometries was then re-imported into QGIS. The points were buffered with the radius of the circle and plotted.
The Pure KNIME Approach
Whilst the QGIS/KNIME combination is my preferred approach (QGIS is far better for visualising results and it took about 30 minutes in total including creating the KNIME workflow). I have also created a pure KNIME approach.
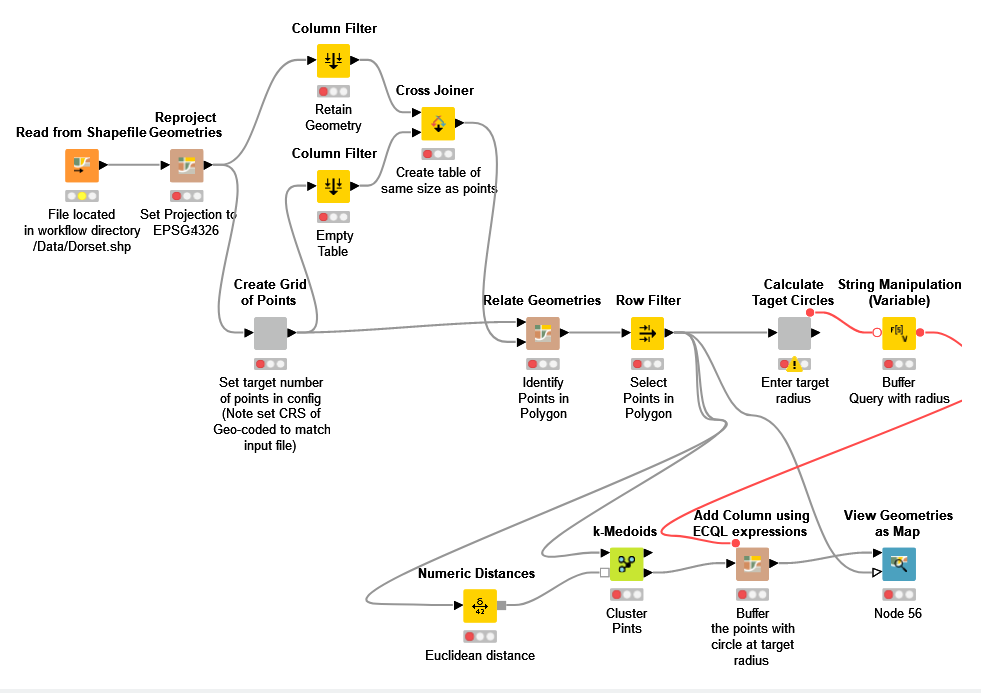
This reads the polygon data from a shapefile. Note, the Spacial Processing nodes are a nightmare and not bug free. I had a lot of trouble with Co-ordinate Reference Systems which is why I switched from EPSG:27700 to EPSG:4326. The workflow generates a regular grid of points (first component). The component has a config option to set the target number of points in the rectangular grid. This is the filtered by the original Polygon (Relate Geometries). Note, relate geometries needs to input tables with equal number of rows, which is why the polygon is copied across the same number of rows as the points.
The points are then used to estimate the number of clusters. The second component has a config to define the radius of the circles. The radius needs to be defined in the same dimensions as the Co-ordinate Reference System (so in this case degrees) - this is why EPSG:27700 was useful (but didn’t work) because the dimensions are metres (yay!).
The points are then clustered. The points are buffered and both points and buffers plotted.
Final results:
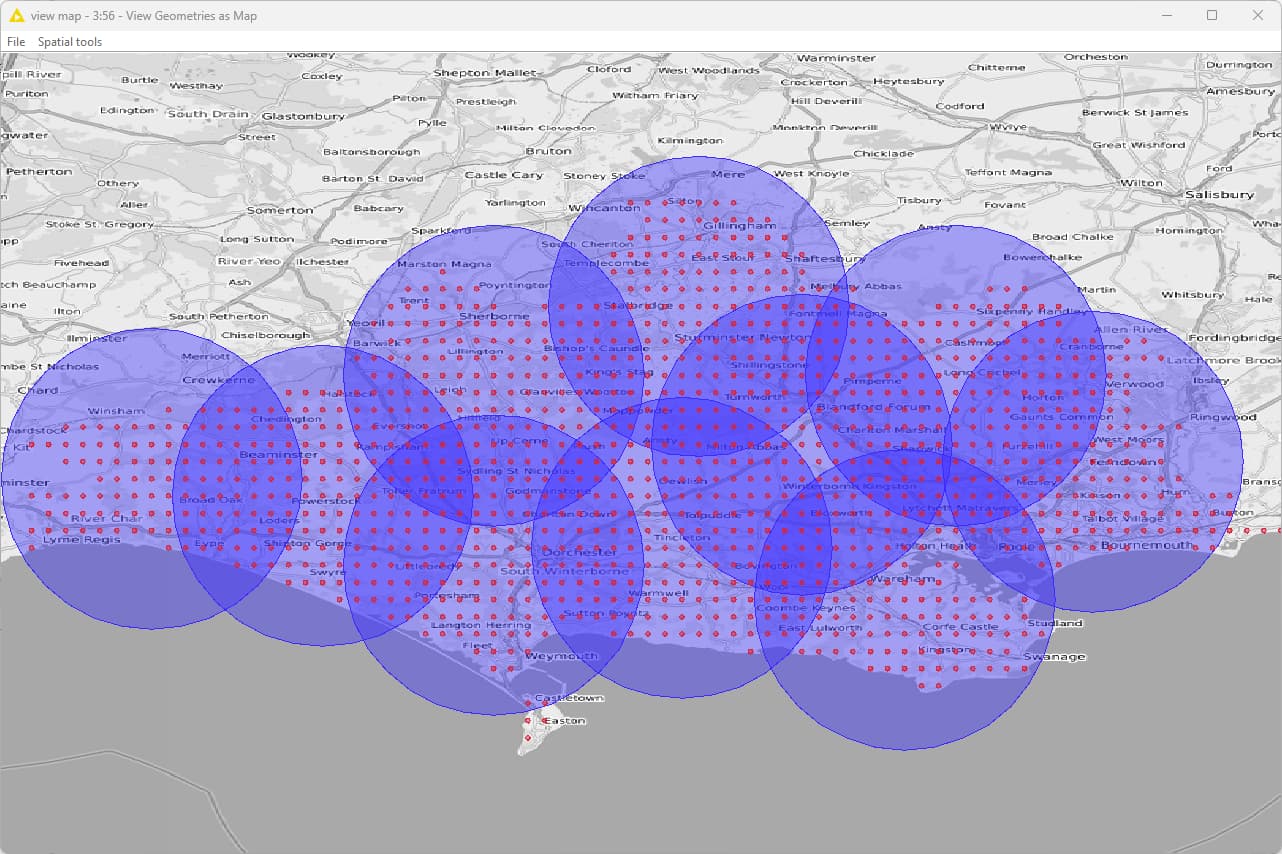
Hope that helps
DiaAzul