Hi all,
I am trying to do mapping with Python using Python Script in KNIME.
The Node is a 1 input + No output node
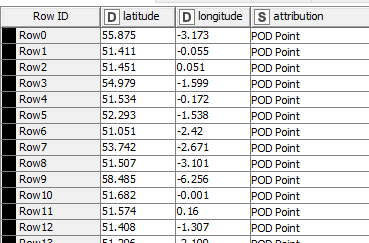
The input to the node is a table with 3 columns. Latitude [Double] , Longitude [Double] and Attribute [String]
I wrote the following code.
import knime.scripting.io as knio
import pandas as inData
import folium

# Load the input table into a Pandas DataFrame
inData = knio.input_tables[0].to_pandas()

# Create a greyscale map with a zoom level of 10 centred in location of those lat/longs
m = folium.Map(location=[50.8, -1.1], tiles='Stamen Toner', zoom_start=10)

# Add a marker for each point
for index, row in inData.iterrows():
    lat = row['latitude']
    lon = row['longitude']
    attr = row['attribution']
    # Create a popup message for the marker
    popup = 'Attribution: {}'.format(attr)
    # Add the marker to the map
    folium.Marker([lat, lon], popup=popup).add_to(m)

#    folium.Marker([row['lat'], row['lon']]).add_to(m)

# Output the map
outData = m
So the Node runs fine without any error. However, I don’t see an output image or map or something.
What am I doing wrong?