Hello,
I made a plot by matplotlib library and I added gridlines as shown in the image.
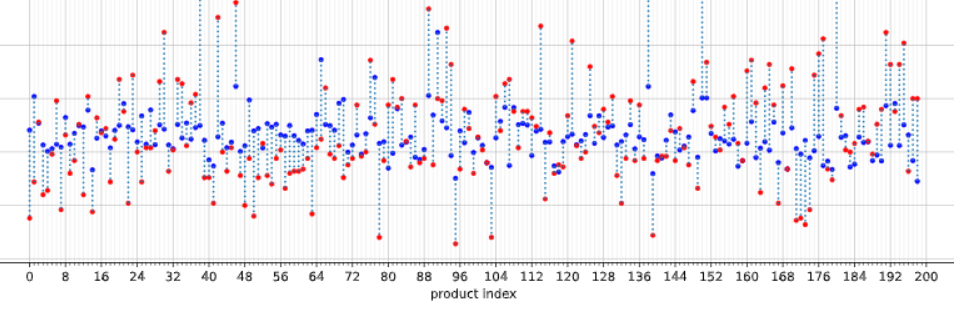
In the interactive view, it is okay I can see it in the Image Widget.
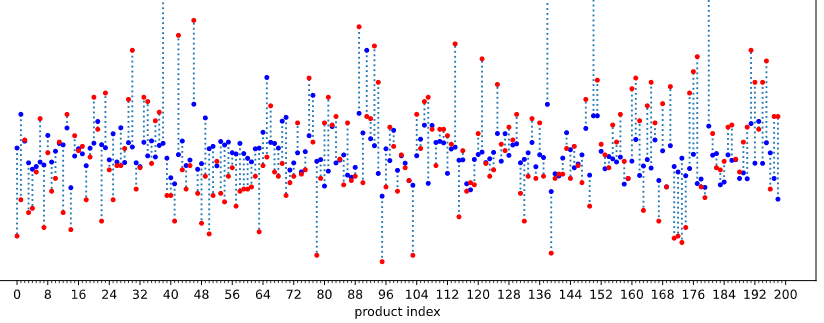
However, when I deployed my workflow on the server, the gridlines disappear…
I don’t know how I can solve this issue, anyone who has an idea ?
The python script code for this gridline part is like this ![]()
Grid
major_ticks = np.arange(0, len(index)+2, 8)
minor_ticks = np.arange(0, len(index)+2)
plt.grid(which=‘both’)
ax.set_xticks(major_ticks)
ax.set_xticks(minor_ticks, minor=True)
ax.grid(which=‘minor’, alpha=0.2)
ax.grid(which=‘major’, alpha=0.7)
Thank you.
Best,