I have a data set which shows which dates some assets were utilized. The data set has the asset, start date, and end date for utilization. I want to figure out what date has the most assets utilized. How would I do that? I am thinking back to past experience with SAS where I’d use a loop and keep a count, but not sure how to do that in KNIME.
The data looks like this:
Asset_Num Start Date End Date
1 1/1/2019 1/14/2019
2 1/3/2019 1/10/2019
3 2/4/2019 7/3/2019
1 1/21/2019 2/12/2019
And so on. It is big, but not huge, 20-30k rows or so.
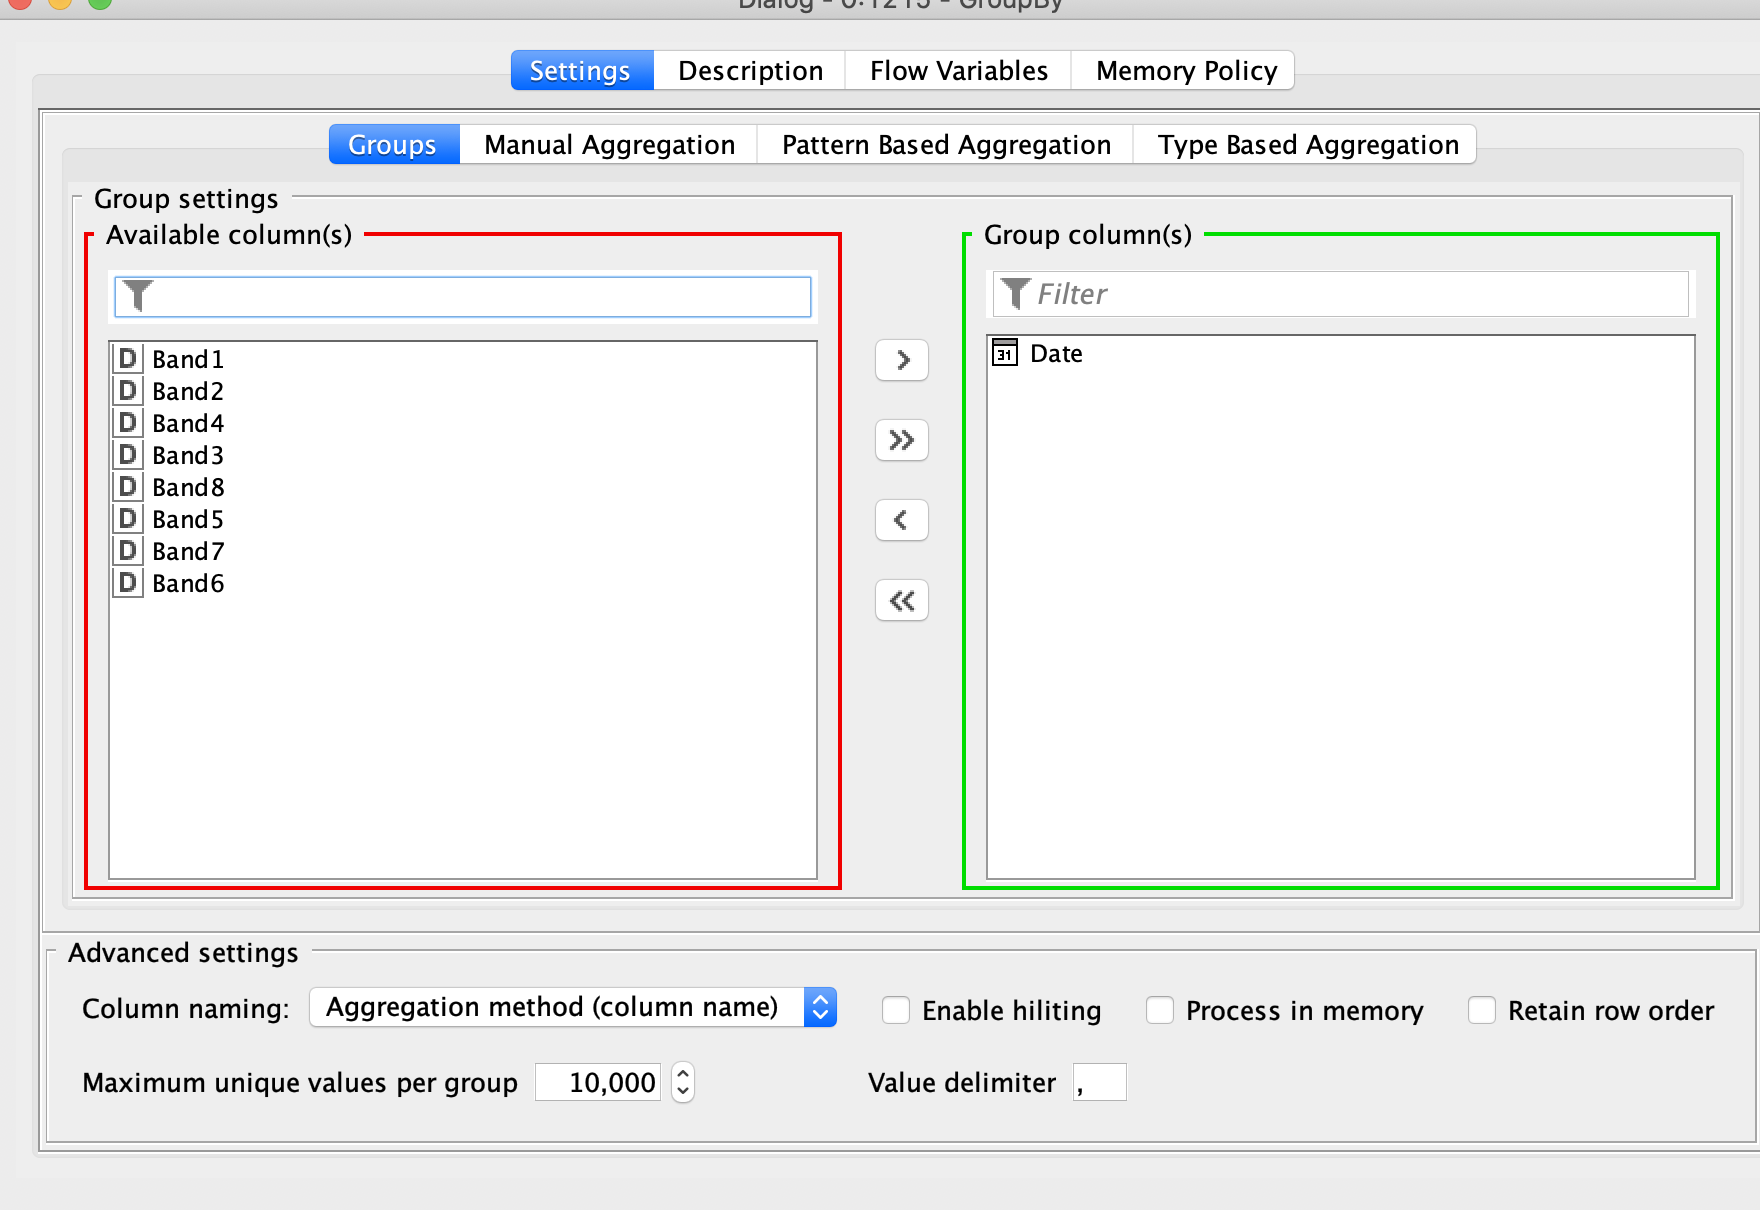
Good question. You can use the GroupBy Node to group by the date, and then aggregrate the maximum for the column of interest. Here I group on the Date Column and then perform some aggregation on the next tabs.
I suggest to convert your range to single dates and assign the value/asset. This will lead to many additional rows. Afterwards you can sum the value or accordingly count the assets with the help of a group by node and then pick the date with max assets.
Please find a simple workflow on KNIME Hub…
As a preparation step you have to transform your start/end date columns to the date format.
With that you’re able to define the start and end date of each range by using the corresponding flow variable within the loop.
Sorry, I didn’t really ask it clearly. I need the max utilization, so in all likelihood its somewhere between the start and end dates where the max utilization occurs.
Yeah, I think this is the sort of thing I am looking for. I have not been able to crack the code on loops in KNIME yet, but this sounds like an approach that would work. Much appreciated, I’ll let you know if it works.