Hi guys, I need your help.
I’m just performing an analysis over some supplier’s bids, and my objective is to spot any unsual relation between bidders. In this case, I have done some graphics in powerbi which are visually effective, but my intention is to capture these cases through a knime workflow. In the picture presented below there are bid rounds (X axis) and bid amounts (y axis). Each line is a vendor.
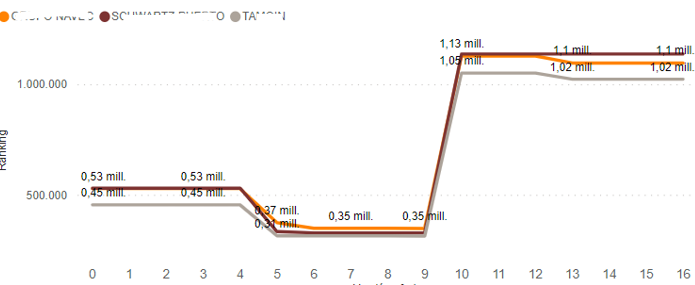
In this example , there is a clear relation in the way bids are changing among suppliers (they almost all increase or decrease in the same rounds, and in similar amounts) I have been trying in KNIME the “Linear Correlation” node, but it gives me some contradictory results (probably I’m not configuring it properly). My input data table is very simple:
| Round | Vendor 1 | Vendor 2 | Bidd amount 1 | Bidd amount 2 |
|---|---|---|---|---|
| 0 | AAAA | BBBB | 729.450 | 767.550 |
| 1 | AAAA | BBBB | 729450.0 | 1.022.400 |
| 2 | AAAA | BBBB | 915.342 | 1.123.284 |
| 3 | AAAA | BBBB | 925.272 | 1.342.899 |
| … | … | … | … | … |
| 0 | CCCC | DDDD | … | … |
| 1 | CCCC | DDDD | … | … |
| 2 | CCCC | DDDD | … | … |
Which is the best way to measure this kind of relation?
thank you very much.