We need some clarification here as we cannot manage server if we don’t know exactly memory needs by KNIME.
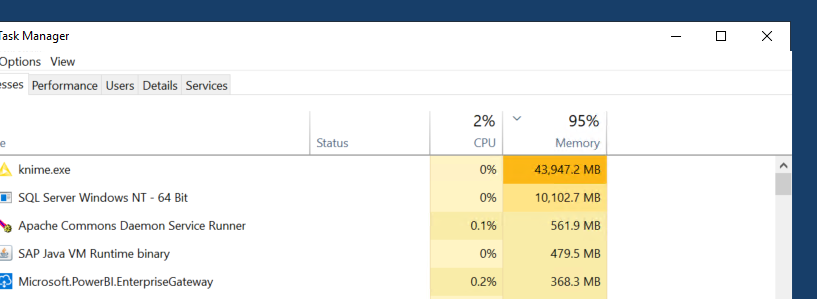
Today we have situation that memory in server used by KNIME service is 43Gb even if we set-up as a parameter 40Gb memory to be used in ini file.
Nevertheless, in server there are no running jobs and it is showing usage of 74% of memory.
Could you please explain that? Is there a way to know the real memory consumption and to free-up memory?
Hi @MarcEM , just to clarify that I’m not a team member, I’m simply curious about this situation.
Would you mind giving additional info?
What version of Windows is this on?
Just so that I understand what you mean the way you intend it to be: When you said ‘there are no running jobs’, did you open any workflow at the time? If yes, how many workflow tabs were active? Was the data all text or are there images involved?
Could you also provide a screenshot of your .ini configuration to show what other amendments were made?
Can you share the full path of: (1) Where KNIME is installed on the PC (2) Where your Knime project local directory points to.
The KNIME Analytics Platform will use a small amount of memory for running itself and use the configured heap space on top to edit and process workflows.
The memory utilization on the OS side will stay stable once the full configured heap space is in use. So looking on OS level you won’t see any changes of the memory utilization. Internally the JVM will process Garbage Collections to free unused memory. This can be monitored by tools like VisualVM.
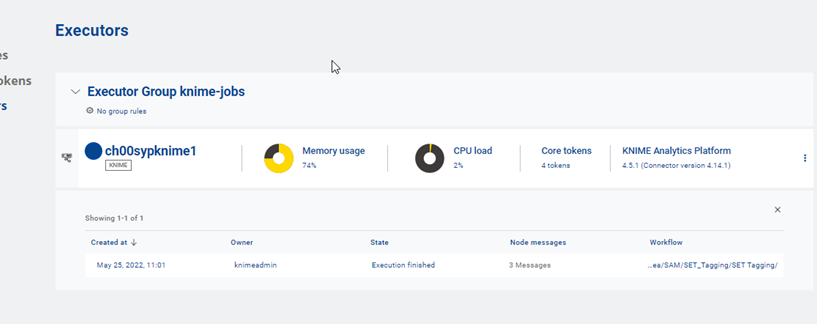
The internal memory utilization will also show up on the Memory usage monitoring of the Executors, 100% will show a fully utilized heap space.
So on OS level you might see that 100% of the configured heap space are allocated by the executor while the executors monitoring is only showing 10%, which is the current internal utilization of the allocated heap space.
Actually, as this is production server, we must be carefully with the CPU and Memory utilization so in order to have this under control we run a job that checks the ussage in real time automatically, in case memory reaches more than 95% then an incident in our system will be generated.
In order to avoid that, we just execute function in a KNIME workflow: System.gc() to clean-up the gc every 1h and it is fine now