Meshplot in Knime

Hi,

I’m trying to figure out a way to make a meshplot in Knime. I’m looking to do something similar to the MATLAB Mesh surface plot function where the the column and row indices are used as the x- and y-coordinates. So for a data array like:

Row1 |2|1|1|
Row2 |2|3|3|
Row3 |3|4|3|
Row4 |3|3|3|

a heat map would be generated with the cell values determining the color and the x,y position from the row/column intersect.

Does anyone know if there is a way to do this in Knime?

Hi @aseeber -

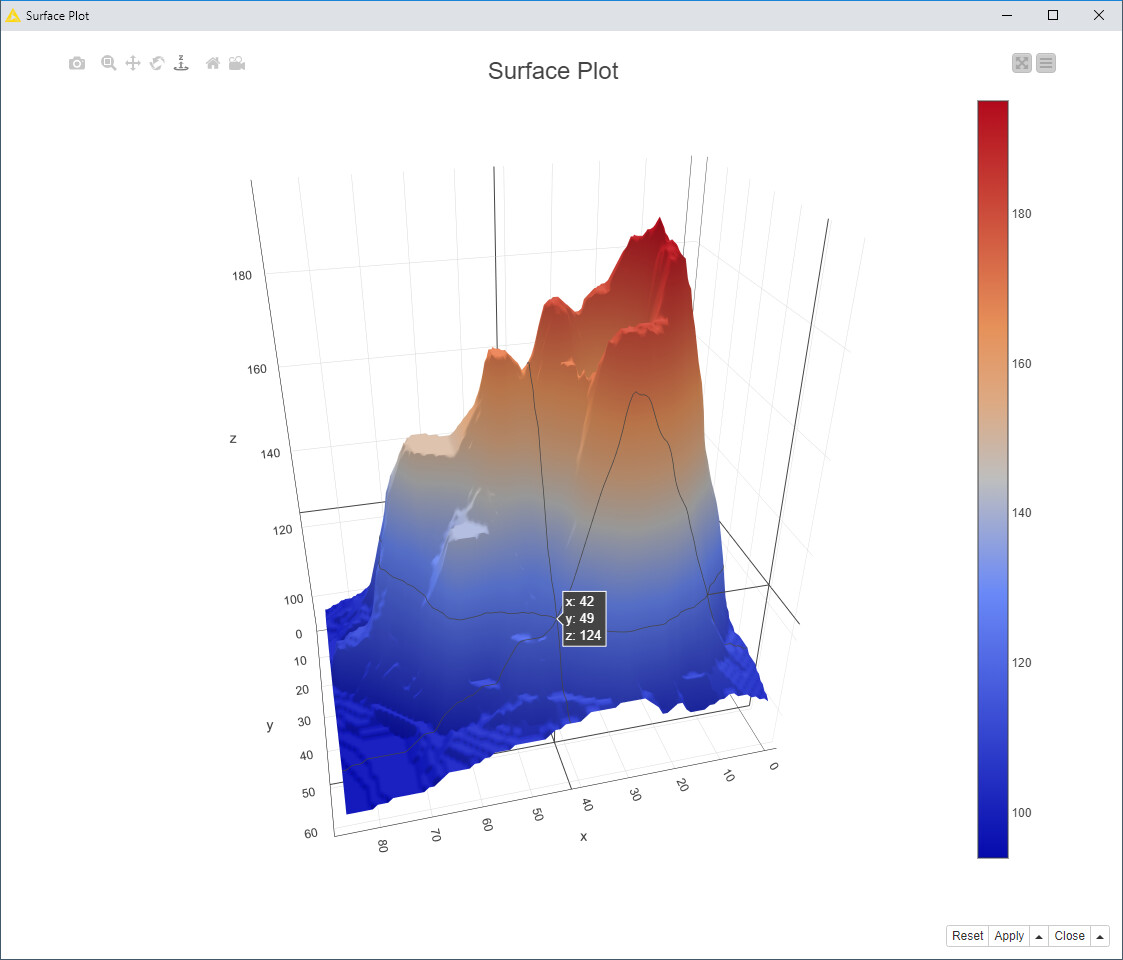
Maybe the Surface Plot (Plotly) node will get you what you want? Here’s an example workflow that generates the following viz:

Oh yes, that will do the job, thank you! I was making my life too complicated. The Plotly nodes seem great.

Perfect! Please do let us know if you have any feedback as you explore the Plotly nodes. :+1:

Just a quick follow up: I was trying some of the different Plotly plots and the contour plot suits my data better. These Plotly nodes fill a nice gap between simple visualization and more serious plotting in R.

What I really like about them is the interactivity, particularly for the 3D nodes. It’s great to be able to click-and-drag a corner of the plot to rotate for a different perspective on the fly.
Oh yeah, and the ability to change filters on the fly as well. Thanks for pointing these plots out to me!