MOSAIQ - Manipulating PSA values (Column to Row)

Greetings! I’m back with a problem … again.

I have pulled PSA values from inside my OI (MOSAIQ), and now wish to manipulate the PSA values from these Prostate Cancer patients.

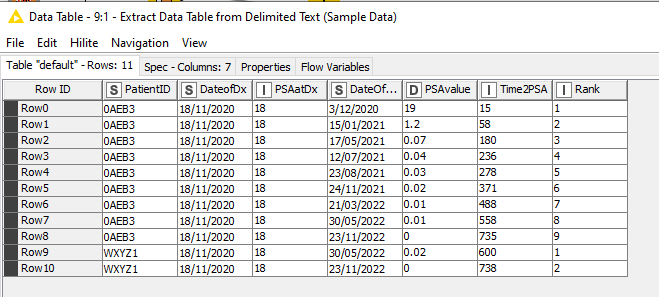
Here is a sample spreadsheet where I have pulled out all of the PSA values (PSAvalue) after the Date of Diagnosis (DateOfDx) with the last PSA preceding the date of diagnosis (PSAatDx), and listed them in temporal order (Rank) with the number of days since diagnosis (Time2PSA) for each patient (PatientID).

PatientID DateofDx PSAatDx DateOfPSA PSAvalue Time2PSA Rank
0AEB3 18/11/2020 18 3/12/2020 19 15 1
0AEB3 18/11/2020 18 15/01/2021 1.2 58 2
0AEB3 18/11/2020 18 17/05/2021 0.07 180 3
0AEB3 18/11/2020 18 12/07/2021 0.04 236 4
0AEB3 18/11/2020 18 23/08/2021 0.03 278 5
0AEB3 18/11/2020 18 24/11/2021 0.02 371 6
0AEB3 18/11/2020 18 21/03/2022 0.01 488 7
0AEB3 18/11/2020 18 30/05/2022 0.01 558 8
0AEB3 18/11/2020 18 23/11/2022 0 735 9

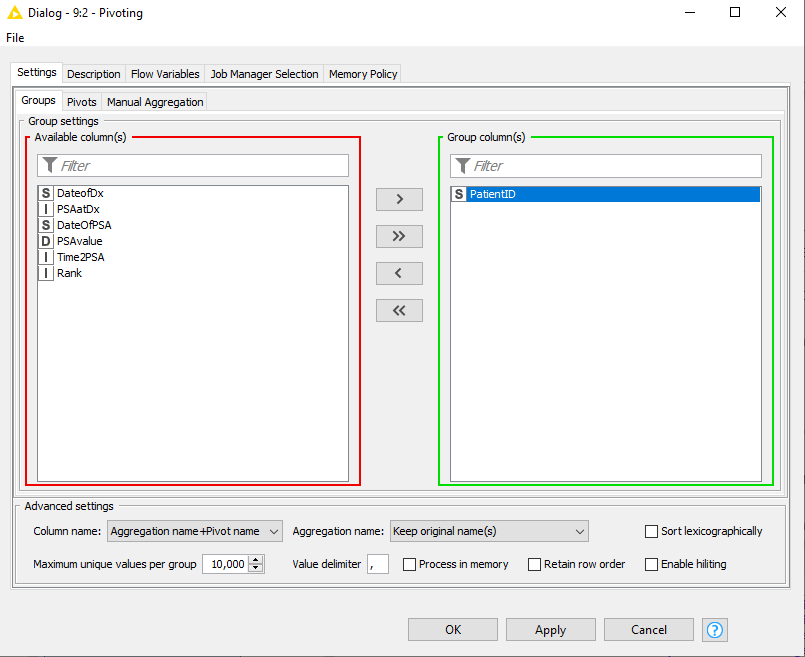
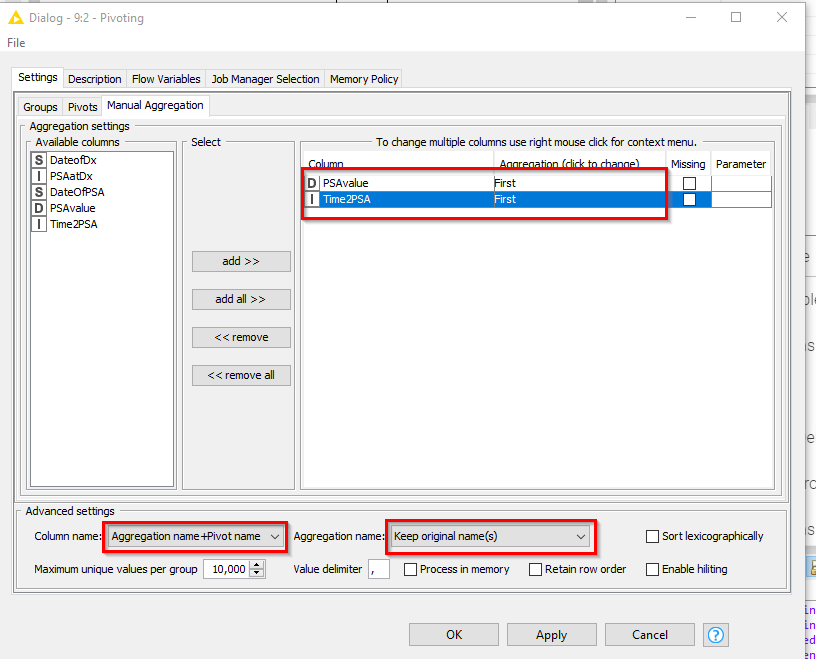
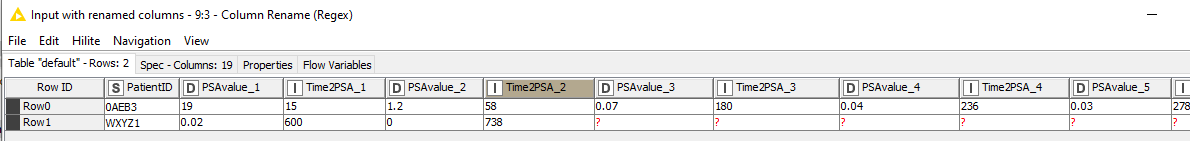
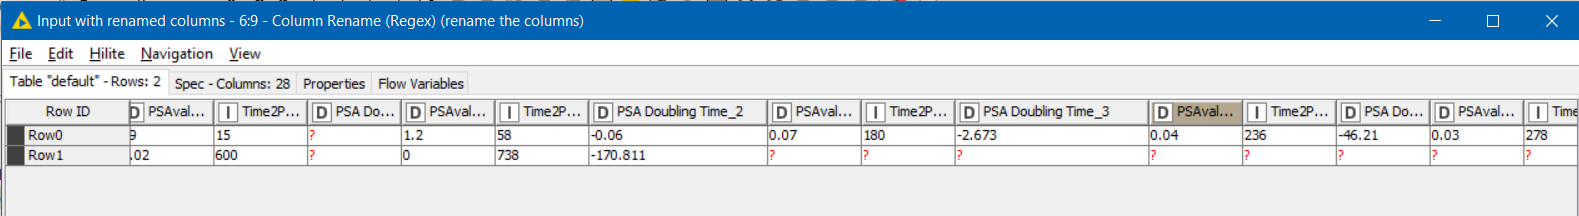
I want these is a spreadsheet where there is one line for each patient (as below):

PatientID PSAvalue_1 Time2PSA_1 PSAvalue_2 Time2PSA_2 PSAvalue_3 Time2PSA_3 PSAvalue_4 Time2PSA_4 PSAvalue_5 Time2PSA_5 PSAvalue_6 Time2PSA_6 PSAvalue_7 Time2PSA_7 PSAvalue_8 Time2PSA_8 PSAvalue_9 Time2PSA_9
0AEB3 19 15 1.2 58 0.07 180 0.04 236 0.02 371 0.01 488 0.01 558 0 735

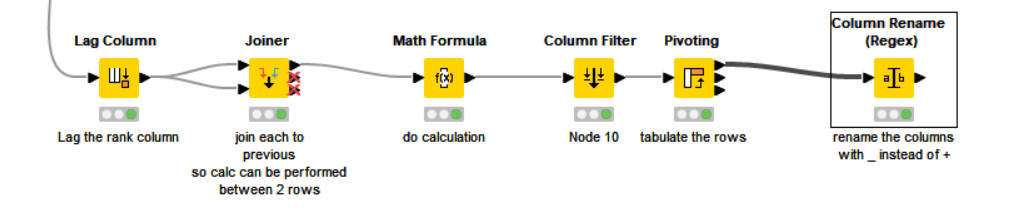
I can do this by using RowSplitter and Joiner, however the maximum number of PSA values and hence iterations of Row Splitter / Joiner pairs is 95!

I’m thinking that there has to be an easier way to do this, hence my request.

Once again , many thanks for the past help.

A

MOSAIQ; OIS; Oncology Information System; PSA

Hi @AAM ,

As you are wanting to take row-based data and tabulate it across columns, this is the job of the Pivoting node.

You need to specify the “Grouping” column or columns, which is the column that acts as the “identifier” for the original rows that are being grouped together into a single row, and in your case will be PatientID

Then specify the Pivots, which is used in the creation of the individual columns, and provides a unique identifier or sequence that will be applied to the new column names. Your Rank column is ideally suited for this:

And finally specify the “Manual Aggregation” which is how the data is aggregated according to the Rank for each of the Patients.

As there is only one row per “rank” for each patient in your original table, you could arbitrarily specify various aggregations (sum, mean, first, last) and they would all give the same result, so here I have just used “First”.

In the “advanced settings”, setting the “Aggregation name” to “Keep original name(s)” means to use the original column names for the items being tabulated (“PSAvalue”, “Time2PSA”), and then by setting the “Column name” to “Aggregation name+Pivot Name”, it will append the pivot name (the value of rank) onto the end of each of these column names which will give you “PSAvalue+1”, “Time2PSA+1”, “PSAvalue+2”, “Time2PSA+2”, … which is (luckily :wink: ) very similar to the column names you require:

Finally a Column Rename (regex) can fix your column names with underscores instead of “+”

image

Here is a sample workflow. I have used your data and added a couple of extra dummy rows for a second patient to prove that it works…

image

image

Tabulating rows into columns.knwf (39.9 KB)

1 Like

Thank you @takbb,

I will get that solution in place very soon. It was much easier than what I was doing and will help in other places too.

A

Follow up Question (@takbb I suspect it’s very similar to the last thing!).

I am able to calculate a PSA Doubling Time for each PSAvalue/PSAdate set (1/2, 2/3, 3/4, etc) using this formula.

ln(2)/(($PSAvalue_2$-$PSAvalue_1$)/(($Time2PSA_2$-$Time2PSA_1$)/28))

But once again it is repetitive, so will the multicolumn Math Formula do this for all pairings?

Once again, many thanks.

@AAM

hi @AAM , the Math Formula multi column wouldn’t be able to perform what you need here, as there is no facility for dealing with columns by offset position or dynamic column naming that you have in this example.

As your calculation is effectively a calculation with the values that come immediately prior, this would indicate that the Lag Column node is likely to be useful, and the calculation can be perfomed prior to the Pivoting node in the previously uploaded workflow.

Since Rank is providing the ascending value for each patient, it makes sense to use Rank as the Lag Column.

A joiner can then join each row on Patient ID and Rank = Rank (-1) (the rank of the previous row). Here I have told it to label the columns retrieved from the “previous” row as (prev), and I also told it to keep the rows where there was no rank match (because it was the first row for a patient).

From the (prev) row, we are just bringing across the PSAValue and Time2PSA columns, as these are the ones required by the formula

The Math Formula node (the single column version) can then perform the calculation using:

ln(2)/(($PSAvalue$ - $PSAvalue (prev)$) / (($Time2PSA$ - $Time2PSA (prev)$) / 28))

Finally, the data can then be pivoted as before but with the addition of the “PSA Doubling Time”

I’ve essentially put your formula in as given. I don’t know if the calcs are right, but hopefully this will help.

Tabulating rows into columns with lag calculation.knwf (53.5 KB)

1 Like

@takbb, so I was wrong again! But thank you for the solution. You are right about the equation, I will have to some manual calculations to verify that it is correct.
PSA values are a real problem in my data as they are not linked to any significant event. The only way to analyse them is to divide them up as pre- & post- by date or assessment like nadir.
yet another instance of poorly defined information system.

Thanks again,

A

1 Like

This topic was automatically closed 90 days after the last reply. New replies are no longer allowed.