Moving Aggregator + Group Loop Start error - window length

Hi all -

I am trying to execute a moving sum that:

  • has a window length of 8 weeks
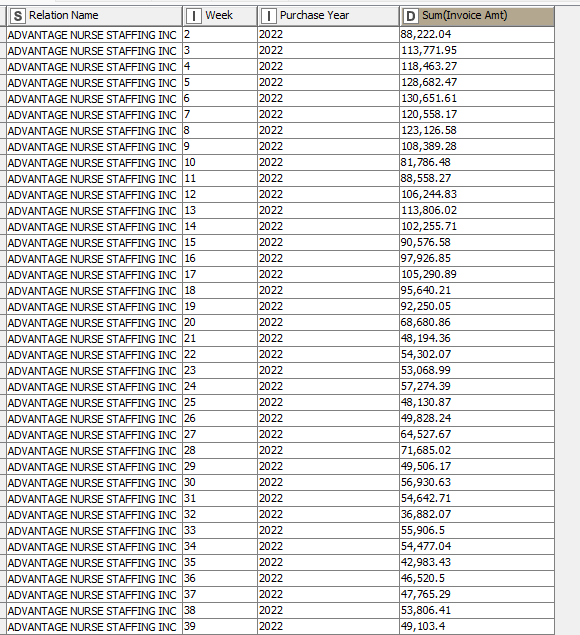
  • changes based on fields Purchase Year (2022 or 2023) and Relation Name (client names, there are about 50)

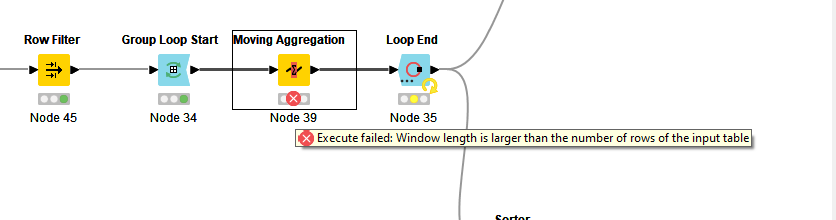
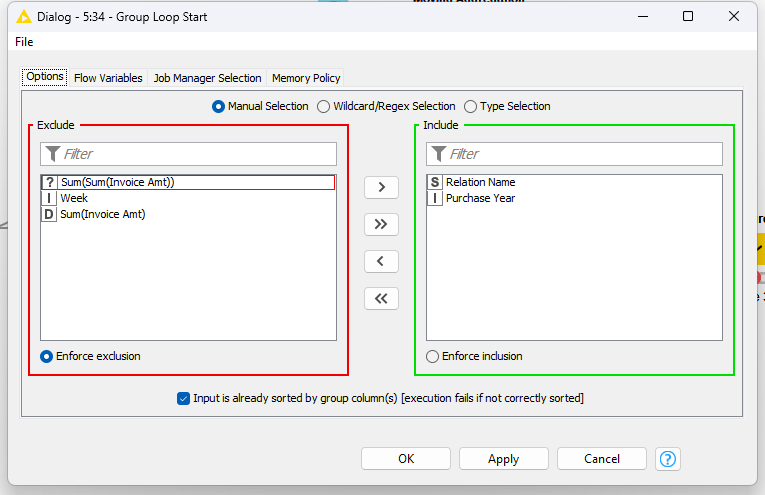
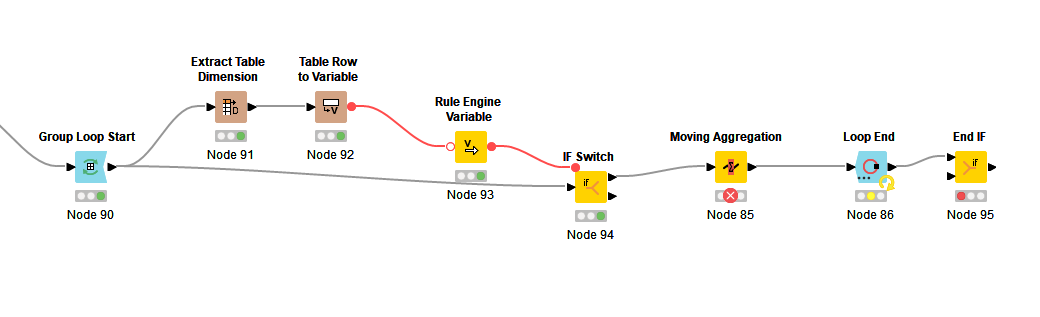
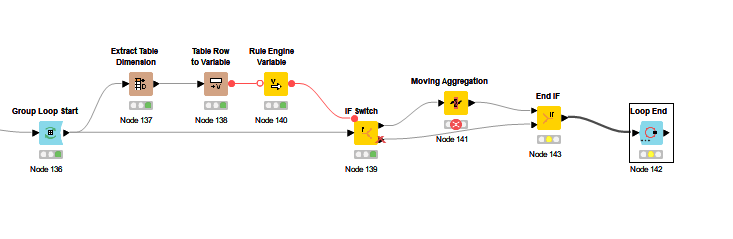
I have the flow shown below, where I sort the fields by: Purchase Year (Ascending), Relation Name (Ascending) and Week (Descending). Then the Group Loop Start where I am grouping by Purchase Year and Relation Name. Then the Moving Aggregator where I specify a window of 8, resolving to an incomplete window if not enough data available, and summing on Invoice Amount. Then the Group Loop End.

I continuously run into errors on the Moving Aggregator: “Execute failed: Window length is larger than the number of rows in the input table”. Some Relation Names have less than 8 rows of data (they only have 1-5 weeks of records, for instance) and the aggregation is failing. When I check "cumulative computation, the flow works fine. But I need an 8 week window, and resolving missing values to an incomplete window should take care of the problem of less than 8 records. What is going wrong?

It also seems like the Group Loop Start node is only cycling through a few of the Relation Names. I reset and execute it individually to see what’s going on, and only 3-4 of the relation names are coming up in it.


Hello @jordanrweil and welcome to the KNIME community
As you already exposed the table length within the loop changes for the different iterations… then you have to refer the window length to the ‘number of rows’ variable.

You can get the number of rows within the loop with the ‘Extract Table Dimension’ node and send the output to a variable. Then configure the window length reading from variable.

I have a workflow example showing this step, that is currently missed in your workflow:

The problem with the $Relation Name$ could be the sorting, with the check option activated in your Group Loop Start configuration settings. You can read in the check box description: [execution fails if not correctly sorted]

I think the best option is to let the Group Loop to work freely, and resort back your data after the loop if necessary.

I hope these indications works improving your workflow performance.
BR

1 Like

Thanks BR for your prompt response. I don’t want to change the number of weeks as a parameter, however. I want it to stay 8, and only resolve to smaller windows in case 8 is not available. It seems that the check box “resolve missing values for incomplete windows” should resolve this, but I’m still getting errors. I connected the nodes you recommended but still hit errors: there are some relation names with only one row of data, and n=1 doesn’t work for window length in moving aggregator.

I want to find a way for the node to aggregate whatever is available for the relation name, moving sum up to a window of 8, otherwise summing what is available even if it is just one row. Does that exist?

Hello @jordanrweil
I wouldn’t imagine windows length n=1 looking your captures…
In this case you have to aggregate an ‘IF Switch’ node. Aiming to bypass the Moving Aggregator in the case n=1.

You will need to add a ‘Rule Engine Variable’ node too, aiming to handle the chose port of the ‘IF Switch’. And an ‘End IF’ node concatenating the bypass flow after the ‘Moving Aggregation’…

In this forum topic there is an sketch showing how to implement a similar case to your use case.

The code that you need for your ‘chose_port’ variable could be like this one (being bottom port the bypass flow):

$${INumber Rows}$$ < 2 => "bottom"
$${INumber Rows}$$ >= 2 => "top"

I hope you can fully execute all loop iterations with these additions.

BestRegards
Gordon

1 Like

Thanks! I’m unfamiliar with these nodes/logic and still running into issues. Attaching the flow I’ve implemented but still hitting all ‘red’ traffic lights. Any ideas? Thanks for the continued help!

Hello @jordanrweil
I guess you are almost in the solution. Things that I see in your current solution:

  • Your ‘IF Switch’ is not completely configured. If you go back to the suggested sketch. you would observe one of the output ports displays blocked with a small red strike. Then, you have to to assign ‘chose_port’ variable to control the output port.
  • The ‘End If’ node should be placed just after the MA and before the Loop End; connecting the lower ‘bypass’ IF Switch’ output port to the ‘End IF’ s lower in-port.
  • End Loop append append requires identical column names and data types from every iteration to work. Then you have to: MA column naming: ‘Keep original name(s)’

I hope this helps to properly configure this bypass workflow. Otherwise we can prepare a mock/dummy workflow, aiming to fix all these functions.

BR

Hi - I think I implemented this feedback correctly, but am still getting the same error. Can you see what I am doing wrong?

Thanks so much for your continued help!!

Hello @jordanrweil
I would need to have a look to your workflow if you can share. Otherwise we can reproduce the workflow if you can provide mock data reproducing your use case. You are not displaying the error message in your snapshot either.

An image showing your current data and expected output would be appreciated.

About the bypass that we were creating; this was build to solve the error of one single week case against Moving Aggregator [MA]. Now you are trying to use as a selective group by (?) for a larger window of 8 items in group loop… you would probably need another bypass for the bypassed group.

BR

It’s real purchasing/customer data so I’m not comfortable sharing the data, but attaching the reset workflow. There’s nothing intrinsic to the data set that is unique to this case though. All that’s going on is:

  • I’m trying to create aggregates for rolling time periods (the exact time period is irrelevant, call it 4, 8, 13, 26 and 52 weeks)
  • Many of our customers do not have sufficient records with the company (only a few invoices, not enough for 8 let alone 52 weeks), so the MA is throwing an error that the length of time is greater than the number of rows being fed to it

What I’m trying to do is tell the MA to sum whatever data it’s got in the case that it is less than the prescribed window. If there are 8 weeks of data, maintain that window and collect rolling 8 weeks PER customer (hence the group loop specifying customer name)

Thanks for your help!!
Contribution Metrics.knwf (139.1 KB)

Hello @jordanrweil
I see your workflow, and it seems quite overcomplicated to me; I mean, I feel that you are trying to build a workflow aiming to force a task to be completed with a specific node [MA]. I’m an unconditional fan of MA, because this node can complete many interesting functions, said so some of the functions can be completed with simple base nodes.

If I understood you properly you have invoices; these can be continuous or not, but you want to group in an ordinal sequence in groups aggregating them together.

An alternative approach would be:
You have a series with the following number of weeks w1, w2, w5, w6, w7, w10, w12, w14… we can rank them with an ordinal sequence: [w1, 1], [w2, 2], [w5, 3], [w6, 4], [w7, 5], [w10,6], [w12, 7], [w14, 8]
Assuming the invoice value for all of them is 1, with a group-by in loop I can get both:

  • cumulative: rank < 4, rank < 8 and then calculate the differentials: cumulative value 4, 8; differentials 4, 4
  • grouped rule engine and then group-by resulting in differentials; group-by SUM[rank1-4], SUM[rank5-8]; differentials 4, 4

Summarizing: rank first and then sum up aggregating by pre-defined groups. This approach will liberate you from MA configuration.

This simple workflow would start with a table for the predefined week bounds (one or two bound columns): 4, 8, 13, 26, 52 connected to a ‘Table Row to Variable Loop Start’ node. Then rank your weeks, then rule engine based on variable, then group-by. Another advantage of group by is that hierarchical grouping with clients is already included, so you only need 5 iterations in this example.

If the case, I can prepare a mock example with random data.

BR

If you hover over the error node it should tell you where your problem is.
br

Thanks for the thoughtful response. Yes this makes sense to me, and a week number is already included in the workflow. The only caveat I would state is that week numbers are unique to each customer, along with the aggregates. So for Customer A, for example, in week [5,3] per your example, if this customer only has two weeks of data [5,3] and [5,4] then the next customer’s date should not start at [5,5] but rather[1,1]

If you are able and willing to draft a mock workflow I would be most appreciative!!

For my reference: is this something that an MA “should” be able to manage? In other words is there just user error that I overcomplicated the workflow, or is this business question best resolved in the way you suggest?

Hello @jordanrweil
Please find attached requested mock workflow. This is the idea behind:

20230704_Aggregate_byGroups_in_Loop_v0.knwf (126.3 KB)

BR

Thank you so much!! I took some time to really digest this. A few questions:

  1. What does “iteration” represent? I never understood this with MA and can’t find an explanation in Knime or online.
  2. Why the lag variable? So between not knowing what iteration represents, and your lag math formula assigning the lag variable based on iteration (directly related to period number I saw), I’m lost on that logical part of the step
  3. Where you calculate “cumulative” and specifically “incremental” - this is where I could insert other calculations? Specifically, I am interested in the change vs year ago. So I have two variables for 2022 values and 2023 values. I would conduct the MA on both of them, and then use math formulas for the CYA formulas?

Hello @jordanrweil
I asume from your answer, that this approach can complete the task initially challenged in the topic.

I will try to answer these questions in correlative sequence, as stated in your post:

  1. ‘iteration’ isn’t related to MA but to the loop function itself. In every step (iteration -sequential integer-) of the loop, the $${IcurrentIteration}$$ variable is created in Loop Start and appended as a constant value in the loop end as a column.
    In this workflow ‘period’ is the loop step we had fixed, it happens circumstantially that ‘period’ ‘correlates’ with iteration.

  2. ‘lag column’ is a displacement of related column +/- #row_positions. In analytic platforms we don’t move/operate in cells as in a spreadsheet; data is stored in columns. Aiming to operate with cells from different rows there are two options:
    option 1 is lag column: lag(-1) refers to data from previous row, lag(-2) from two rows above. Then you can operate data from different rows with simple math formula in columns. In this case set zero at the starting client sequence based in iteration but in fact is the first period ==4. I wrote both formulas in the node aiming to clarify (doble slash is commented)
    image
    option 2 is scripting, we’ll not cover it now (column expressions, Py, R …)

3.1. Based on my previous answers, you already see that we calculated the differentials with previous period. Sorry about it, I called differentials in my previous post but labeled incremental in the workflow (in terms of displayed data-frame are incremental), however all of them are cumulative of periods, group by (unbounded/less than) and differential/incremental (bounded) .

3.2. Aiming to compare previous years, let’s assume you have a year column in data, arranged in long format; there are probably several ways to do it but… I would procced as follow:

  • loop over years and periods in a concatenated way (periods table as follow)
    image
    As you see, periods and iteration don’t correlate anymore… then your blank zeroes have to be referred to period ==4. The loop filter with the following code:
$rank$ <= $${Iperiods}$$ AND $year$ = $${Iyear}$$ => TRUE
TRUE => FALSE
  • proceed with your calculations after the loop as in the mock workflow
  • you can finally pivot the years vs target column and compare them side by side (math formula…)

I hope this contributes to clarify

BR

1 Like

Thanks for the continued explanation. What does TRUE=>FALSE do? It seems like you’re reversing the outcome of the statement, why not just make the original statement resolve to FALSE?

Hello @jordanrweil
It’s a kind of consensus within the extended data science community… but depends on the context to make it easier and efficient.
Rule-based Row Filter as default status, considers TRUE all that hasn’t been declared as negation in rules. At the end you can filter out (node options):

  • include the TRUES by ‘Include TRUE matches’ option
  • include FALSE by excluding TRUE: ‘Exclude TRUE matches’ option

If you realize, it isn’t expressed as ‘Include FALSE matches’ option.

At the end you can declare it as you feel more comfortable with:

  1. by positively defining what’s included (Include TRUE matches), and TRUE => FALSE dismisses remaining (not declared as TRUE)
$rank$ <= $${Iperiods}$$ AND $year$ = $${Iyear}$$ => TRUE
TRUE => FALSE
  1. by rule FALSE about what is included by default (Exclude TRUE matches). As you see, and despite it’s stated as one single line of code (as TRUE => TRUE doesn’t need to be coded); you need to think twice about what’s included due to natural thinking.
$rank$ <= $${Iperiods}$$ AND $year$ = $${Iyear}$$ => FALSE
  1. more complex options ruling negative, that can be valid as well (Include TRUE matches)
NOT $rank$ <= $${Iperiods}$$ AND NOT $year$ = $${Iyear}$$ => FALSE

BR

1 Like

This topic was automatically closed 90 days after the last reply. New replies are no longer allowed.