Hi,
in regard to the ongoing performance conversation amongst the Star Alliance I want top bring to your attention a possible memory leak.
Reproduction
- Start Knime via Shell
.\knime.exe --remote-debugging-port=9222 - Inspect it in Chrome and observe the Performance Monitor
- Create an empty workflow > Place a table creator > Wrap it into a Meta Node
- Open the Meta Node and replicate the Table creator 100 times
- Open then Close and repeat 10 times > Close Workflow > Repeat the opening-close procedure
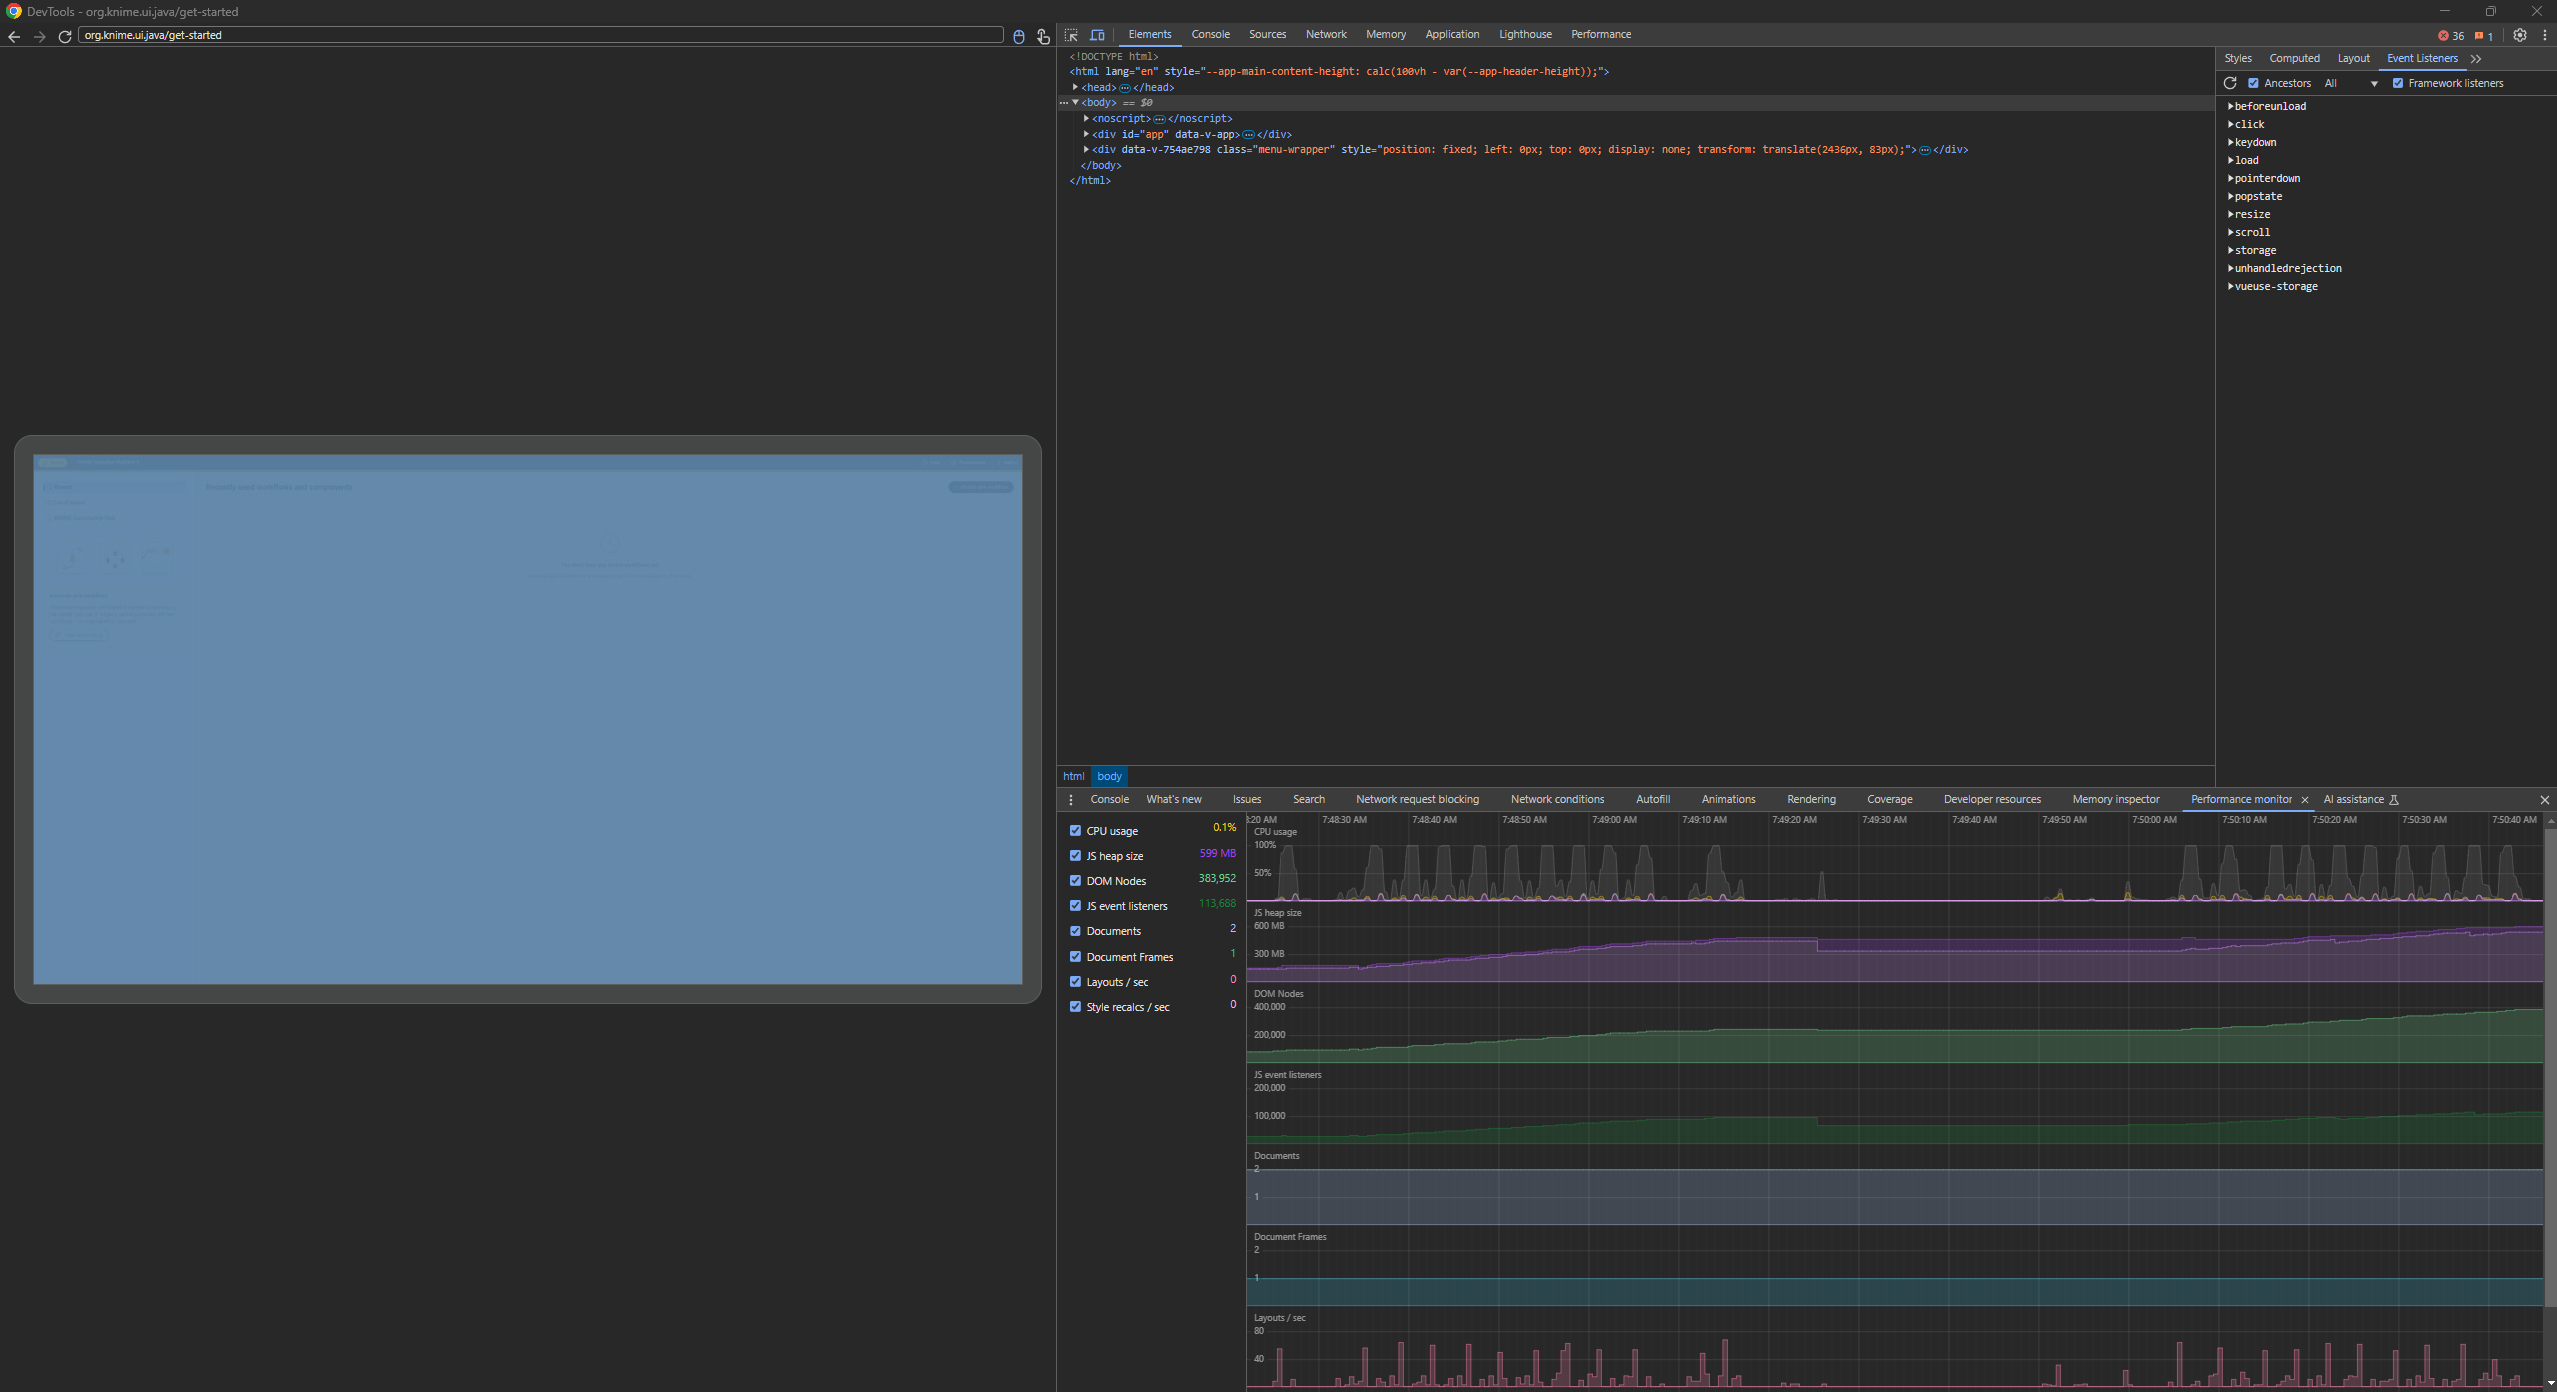
There clearly seems to be something wrong as the amount of DOM-Node count, Event Listeners, and consequentially memory usage is only going up.
Considering that the JavaScript-based UI only leverages one CPU core and rendering is also done on it, performance is expectably diminishing over the course of using Knime.
Neither save & closing the workflow nor running Garbage Collectors seems to work
Archive with screenshots, heap- and thread dump (download valid until Feb. 11th)
Best
Mike