I have tried to research this, and I just haven’t been successful in finding the ‘right’ solution or key words.
I have a data set that I want to process against. The first handful of columns left to right are dimensions and typically do not change. However, after those columns there are columns that change often. Each one of these columns is a week of the year. So, this means that new weeks are added, old weeks drop off and number of weeks in data set can vary (this can be standardized to a specific number, but I want full fluidity). The column names are typically a date or similar fashion.
The objective is to run analysis from one column to the next for trend analysis and outlier insights for each row item. So, as you might suspect using math formula on column names is not feasible due to the number of columns and their dynamic nature. I think a loop might be one approach (I am not familiar with it and still learning how to leverage this). Another I see is standardizing the column names for processing then converting back to the correct naming function.
Looking forward to the insights and solutions from this talented community.
Hello @davehansen
You are pointing to a possible solution: loop and standardized column names
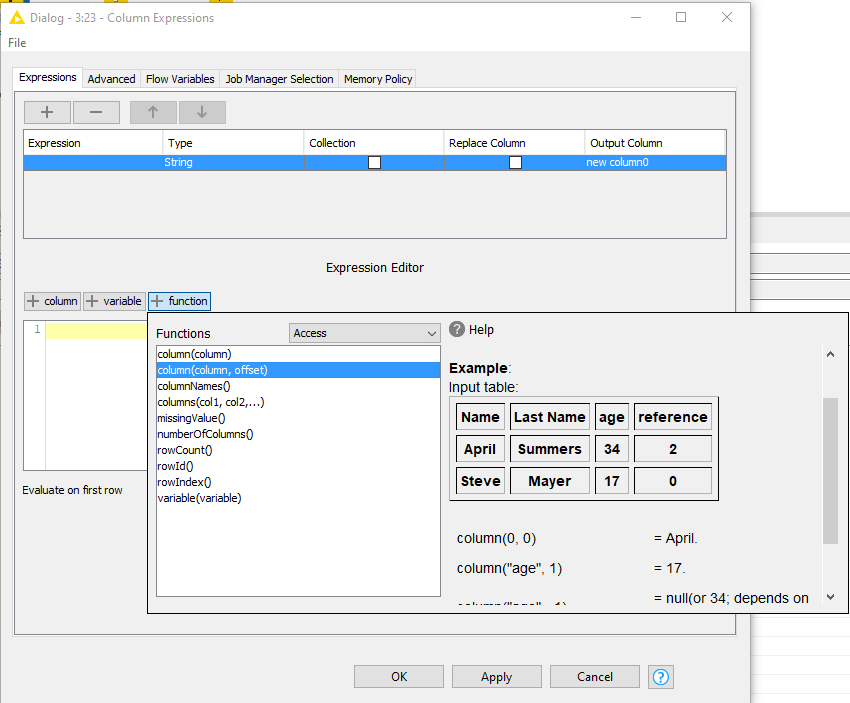
Once you get your columns in the loop, you just have to replace the column names by generic names aiming to feed the ‘Math Formula’ node. And renaming back after the math node with captured variables. Possible nodes to work with: Column Rename, Column Rename (Regex)
This approach is straightforward but requires some experience configuring the nodes and variables.
Sometimes you can avoid these complex column loops by reshaping the data. If you can prepare a sample or dummy data-set, we in forum could design alternative solutions for this challenge.
But as mentioned, if you can share a workable format of the data in your screenshot then someone will be able to cook something up without having to type if all over
So I assume you could split the data using column splitter or sth so you have your weeks separated and then unpivot those to do your trend analysis from top to bottom instead of left to right? That would be my approach.
br
Thanks for the data @davehansen
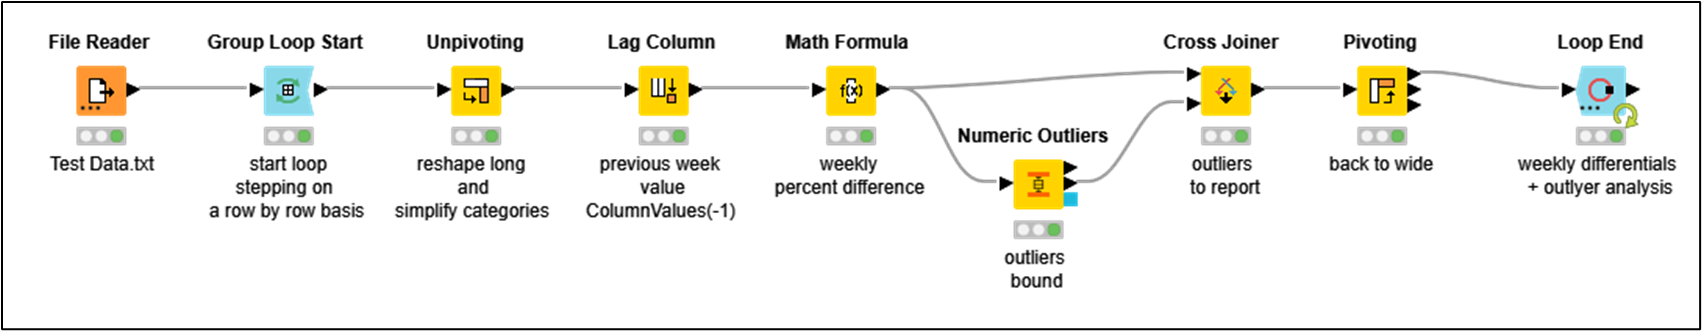
Here is an example about, how reshaping your data is very simple. And processing columns in KNIME has to be an exceptional task.
The workflow is still a draft, and the analysis (weekly differentials and differential outlier analysis) is very basic. However it can give you some insights on how to proceed.