Hello everyone,
In my table I have several columns and each column has a few rows with measurements and also a row for min and for max value. I want to have a graphic where the measurements and the min/max values are for example side by side for comparison. I thought of an box plot or an statistic view, but I don’t know how to do it. I already have a scatter plot in which min/max have a different color, but I had to apply a color on ervery row… that didn’t seemed right as well.
Thank’s for helping out!
Hi @thorben_hensch ,
Maybe you can use the groupby node to set max and min value from columns and then make the graphic plot.
Tks,
Denis
1 Like
Thank’s for your answer, but that doesn’t seem to work. the problem is, that I can only view one input on a conditional Box Plot. So either the min/max values for the measurements or the different values of the measurements. But I want them side by side in a plot so I can compare them. Hard to explain.
Hello @thorben_hensch and welcome to the KNIME community
A dummy example would be desirable; even when you think that your description is clear, it can be hard for us to interpret it. Even I already have an alternative interpretation from your description.
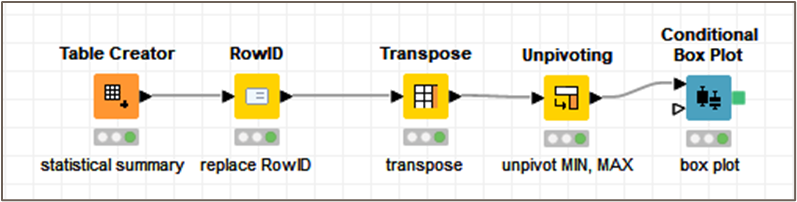
From your challenge description and what I understood from it (interpretation1). I think That you need to:
-
Replace the ID with your statistical descriptive column with ‘RowID’ node (remove selected column option)
-
Transpose the Table with ‘Transpose’ node.
-
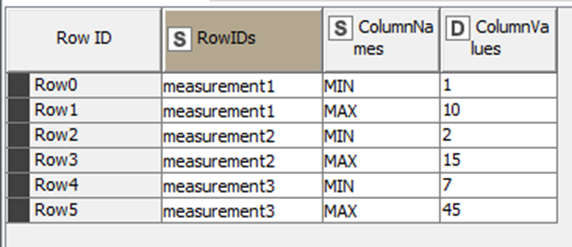
Finally, Unpivot MIN and MAX columns (or all the box plots that you want to display) [do not retain any column]
-
If I’m not wrong with your whish list, you are ready to send this data to conditional Box Plot

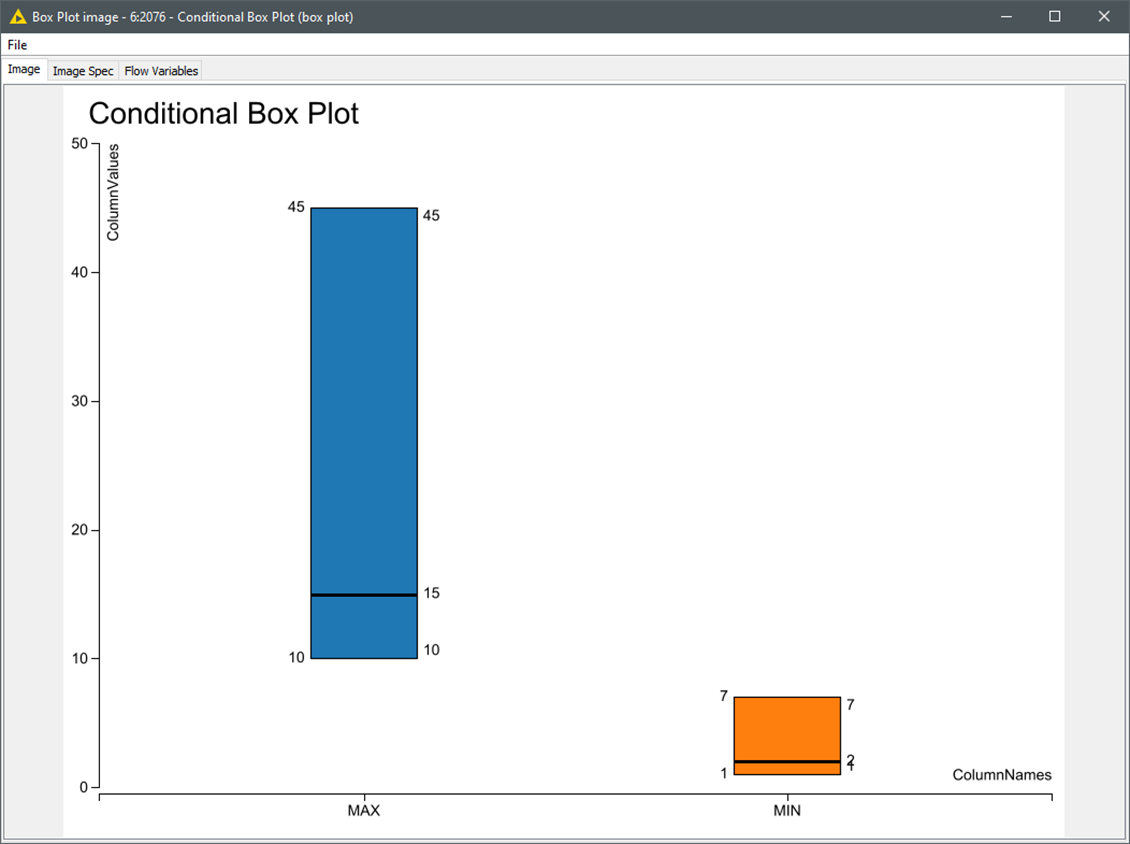
NOTE.- Because there are only 3 values per box plot, no min/max bars are visible as they are on the top of Q1 and Q3 box marks.
BR
2 Likes
First of all thank’s a lot guys!
The RowID and the transpnse node helped me a lot.
But it’s still not exactly what I meant, so here is my dummy example:
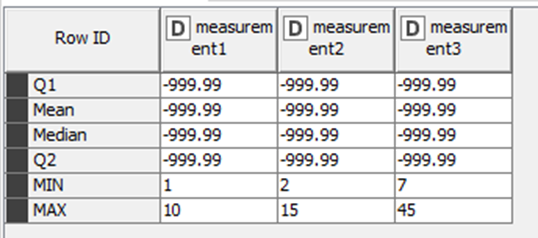
This is the table structure I have:
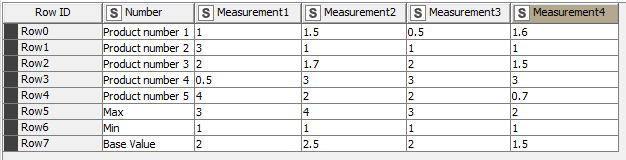
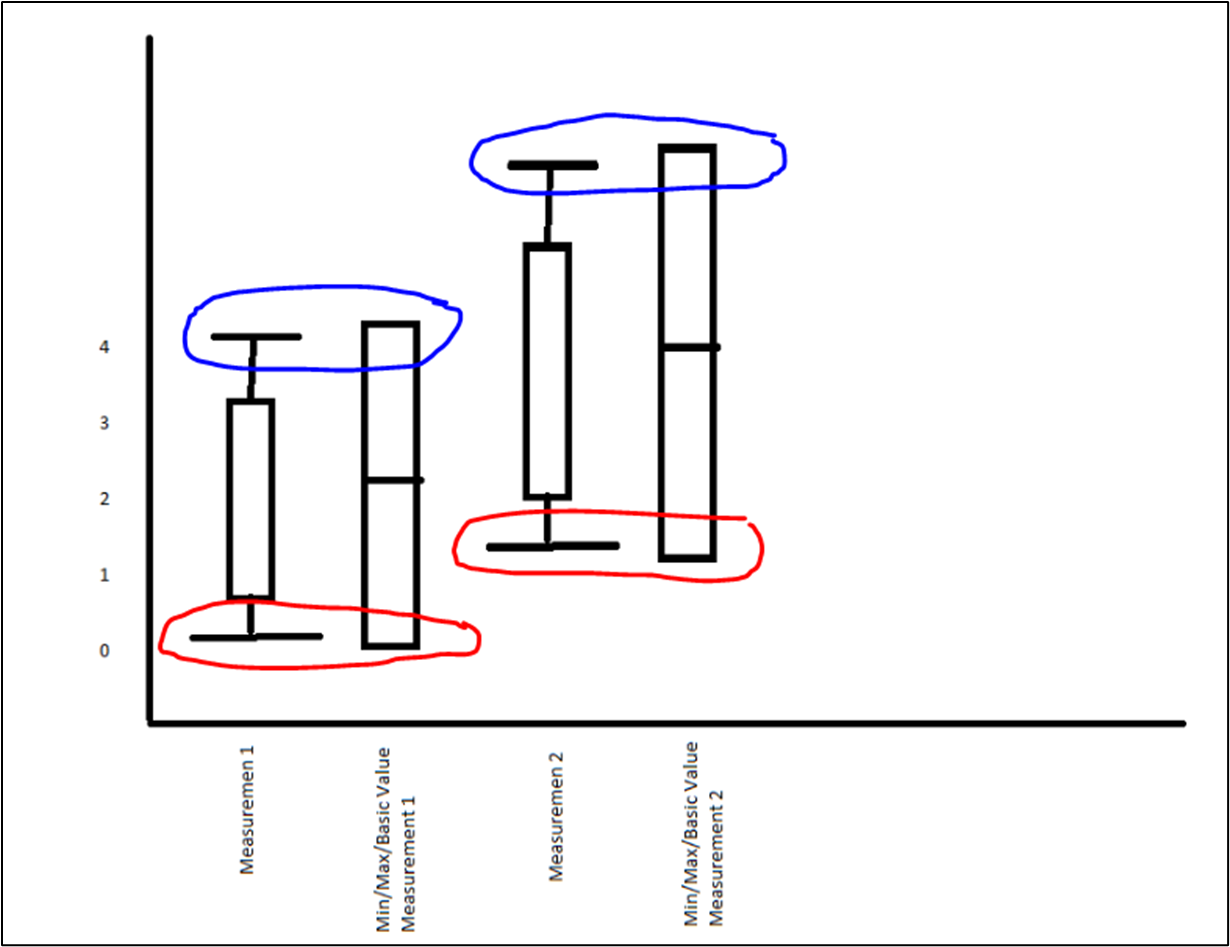
And I want to compare the different Measurements with the Min/Max/Base Values. Maybe like this:

Again, thank’s a lot!
1 Like
Hello @thorben_hensch
At this point and looking at your dummy example, I’m in a deep sea of doubts…
Box Plots’ whiskers (i.e. Measurement1) already represent the MAX and MIN… sometimes they are included within the Q1/3 +/- 1.5 IQR, so the whiskers are already represented in chart; some other data represents them as outliers.
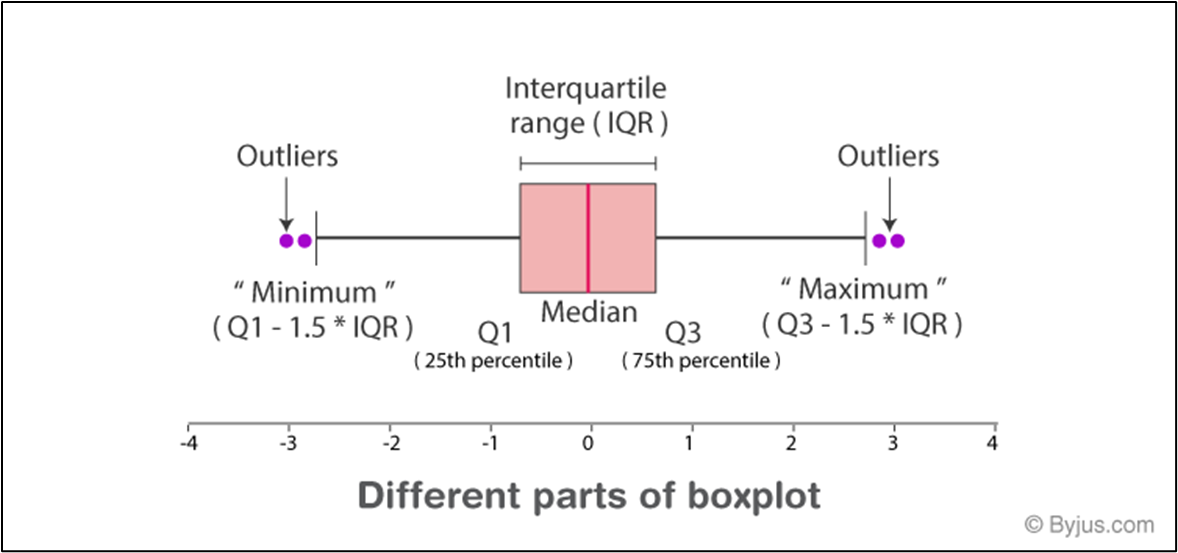
I cannot see the point of representing MIN/MAX disaggregated for individual measures. Can it be done? yes. Should you do it? not really.
BR
1 Like
Hello gonhaddok,
again thank you for your time. I see your point, so I guess box plots don’t really make sense when it comes to comparison with min/max values and measurements.
But how can I compare the different measurements from the different products with the min/max values?
Hello @thorben_hensch
In your example table I can see Measurement raw values, and a statistical summary table appended from Row5 on. Aiming to do this you would need to put it into context with a category/hierarchy column aiming to differentiate what is value data and what is description/interpretation.
I think that you are translating some spreadsheet mindset to KNIME. Let me explain it. In an Excel world, data is stored in cells; in data analysis software, data is stored in columns. I mean, the statistical summary is implicit in your data (‘Product number #’ values). Yu can query any statistics at any time in a separate able or chart with different nodes.
Coming back into your dummy example chart, Min a Max are redundant making the chart very busy; as they are already represented in your box plot whiskers…
As summary, you can make a boxplot with whisker gathering the minimum, max, mean… values of the measurements. This is the plot that I I illustrated in my first answer.
BR
1 Like
This topic was automatically closed 90 days after the last reply. New replies are no longer allowed.