Hi, i’m trying KNIME as a science reseachar. Please show me how to make lineplot with more than two data series they dosn’t have common x-axis.
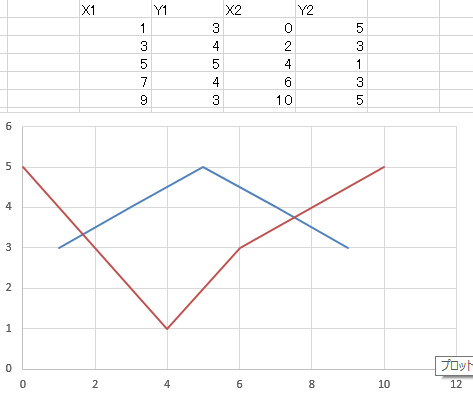
I attached a figure ideal line plot formed on excel.
Thanks in advance.
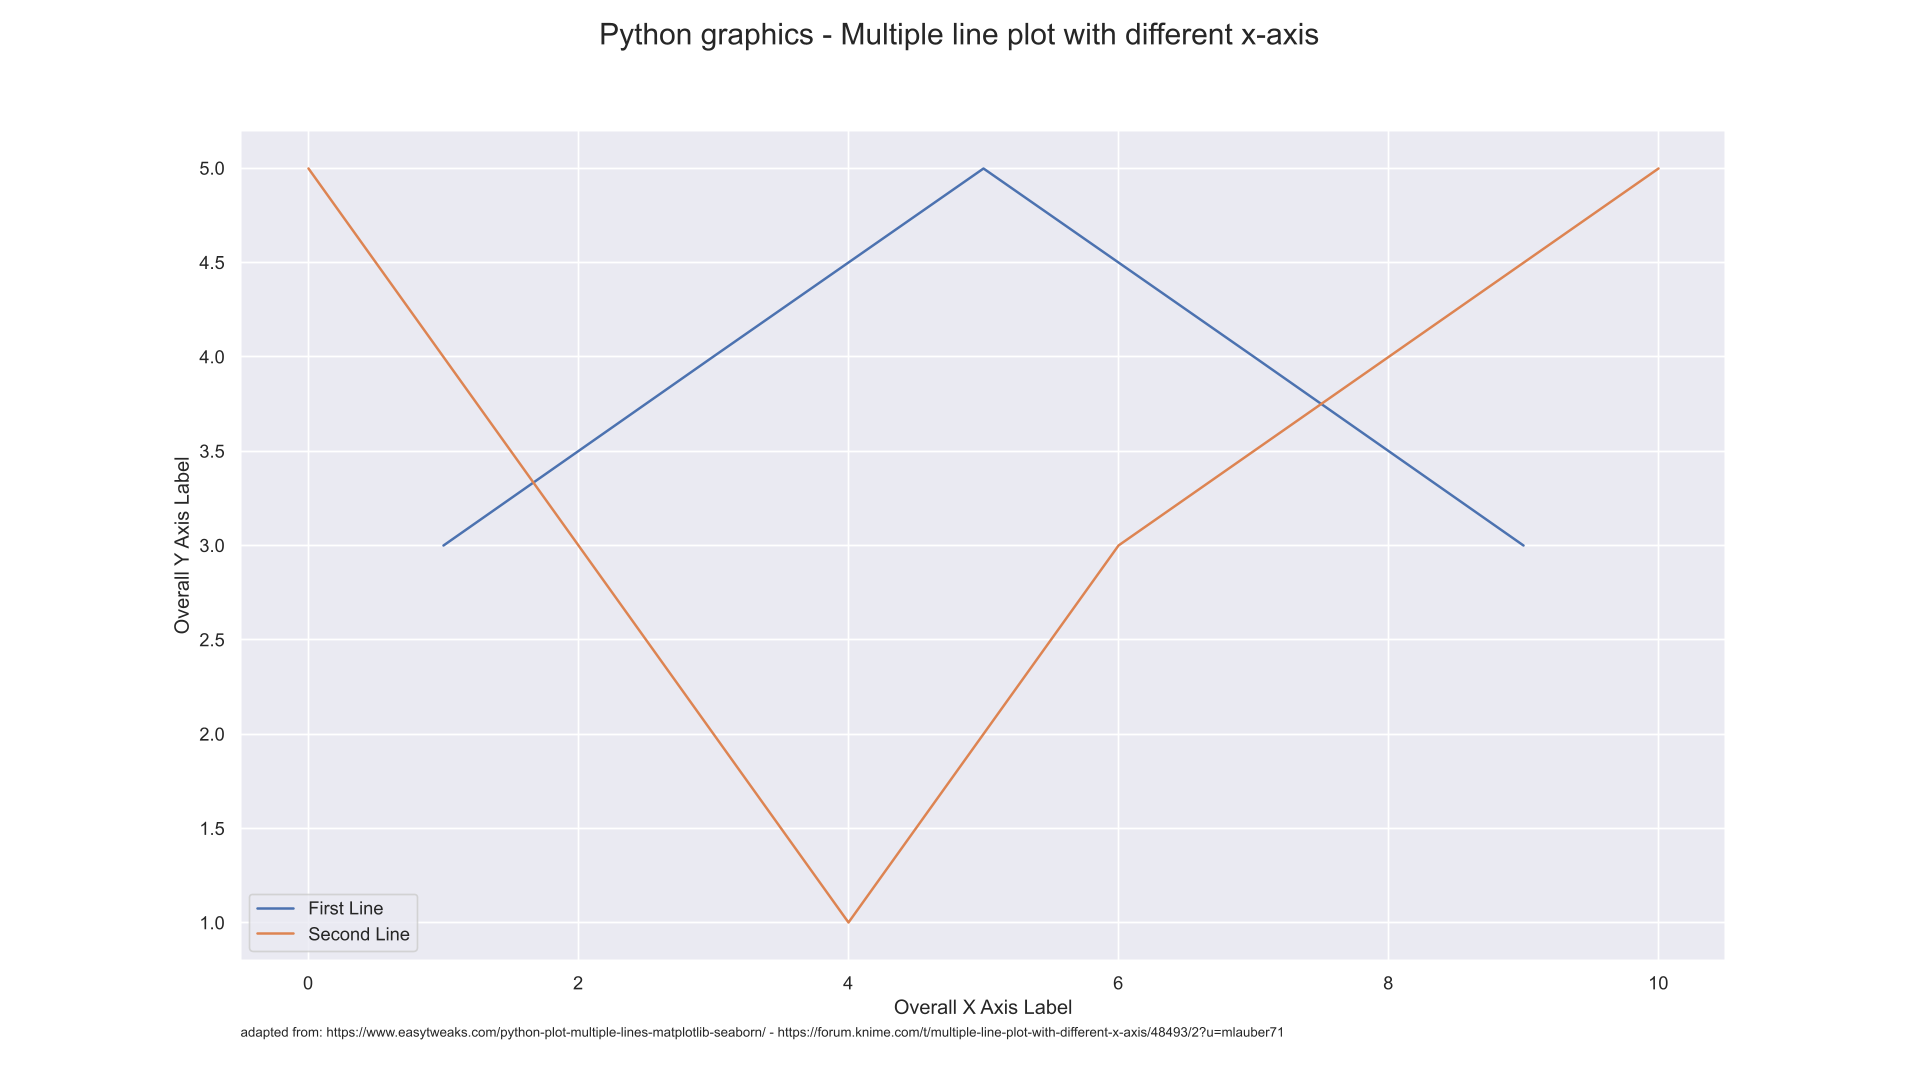
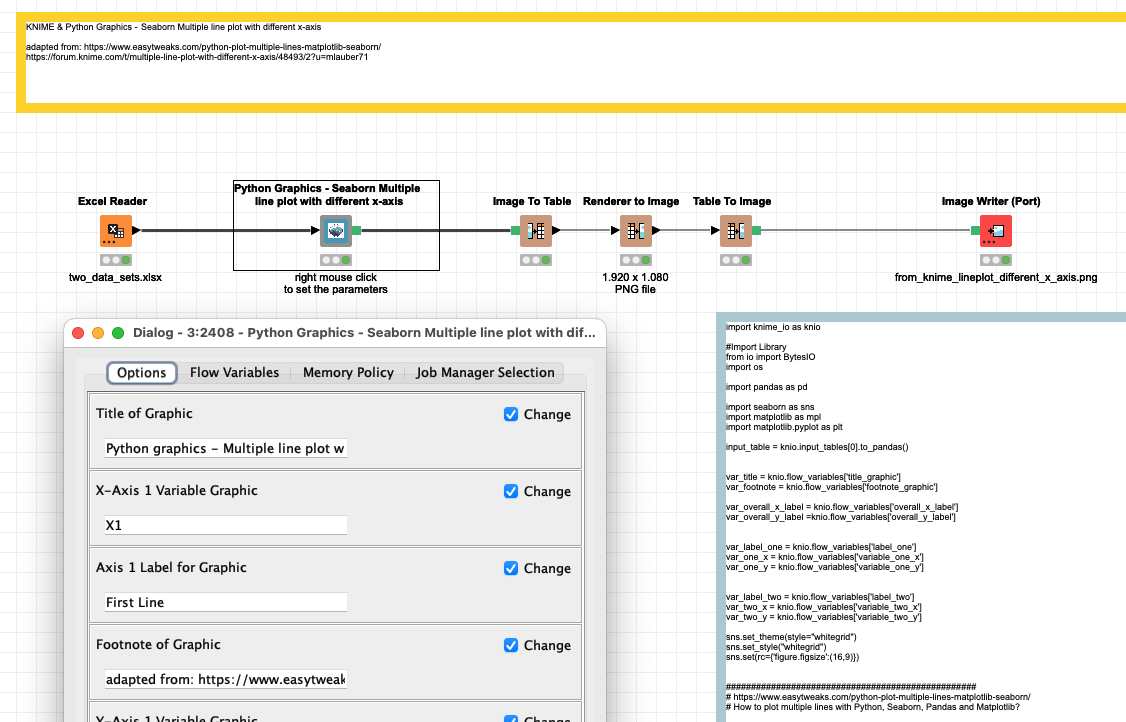
@kentatanaka welcome to the KNIME forum. You could do this by using the (new) bundled Python environment (What’s New in KNIME Analytics Platform 4.6 and KNIME Server 4.15 | KNIME) and Seaborn package with some configurations.
2 Likes
Hi kentatanaka and welcome to the KNIME Forum,
one option is to reshape your data like this
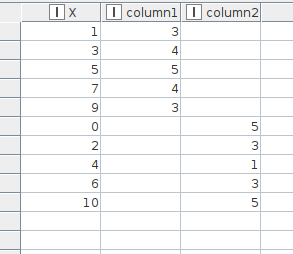
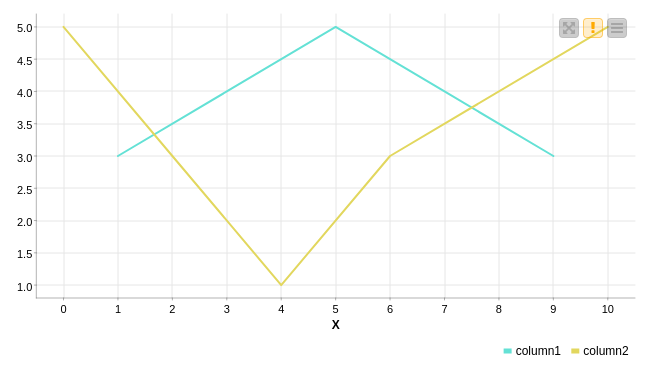
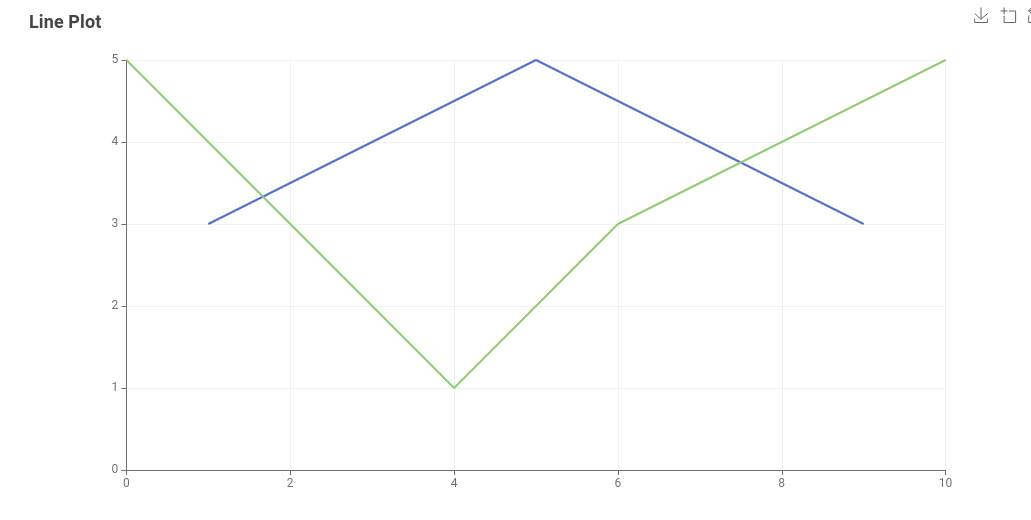
The new Line Plot (Labs), as well as the Line Plot then both show what you want.
Hope this helps.
3 Likes
Thanks nan. This solution is easy, and would be available for several data series. I’ll try this too.
Thanks mlauber71. This solution is not easy, but makes it possible what I want. Because I can make Python code, I’ll try this and expand number of data series 2 to many.
For unlimited number of data series, there doesn’t seem to be an easy way out.
You could try and do this with a pure python code and maybe a loop inside. The use of a component was just since I had other such examples at hand that I could use.
You could build some sort of meta table and try to create the multiple axis in a loop.
This topic was automatically closed 7 days after the last reply. New replies are no longer allowed.