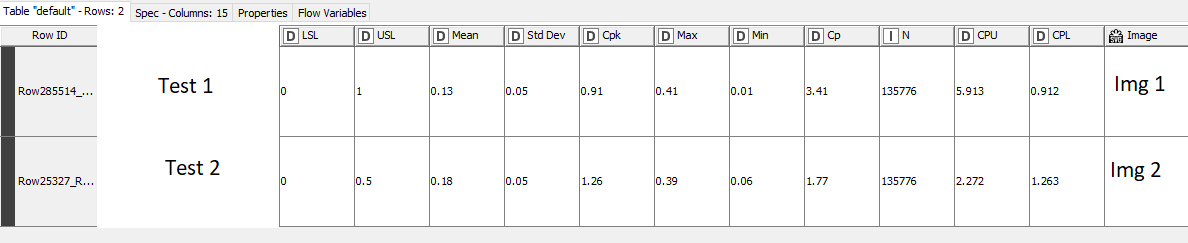
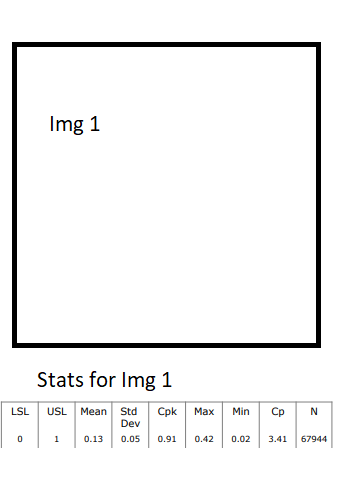
Add a table to your report with 2 detail rows and only 1 column and bind your dataset to it.
In the first detail row add your image item (dynamic, using bound dataset) and in the second detail row, add a grid with 2 rows and as many columns as you need. Then, in the first row of the grid add labels according to your column names (stats). In the second row of the grid, add data items using the bound dataset. Finally, “always” use page breaks “after” the second detail row of the table item.