Hi All,
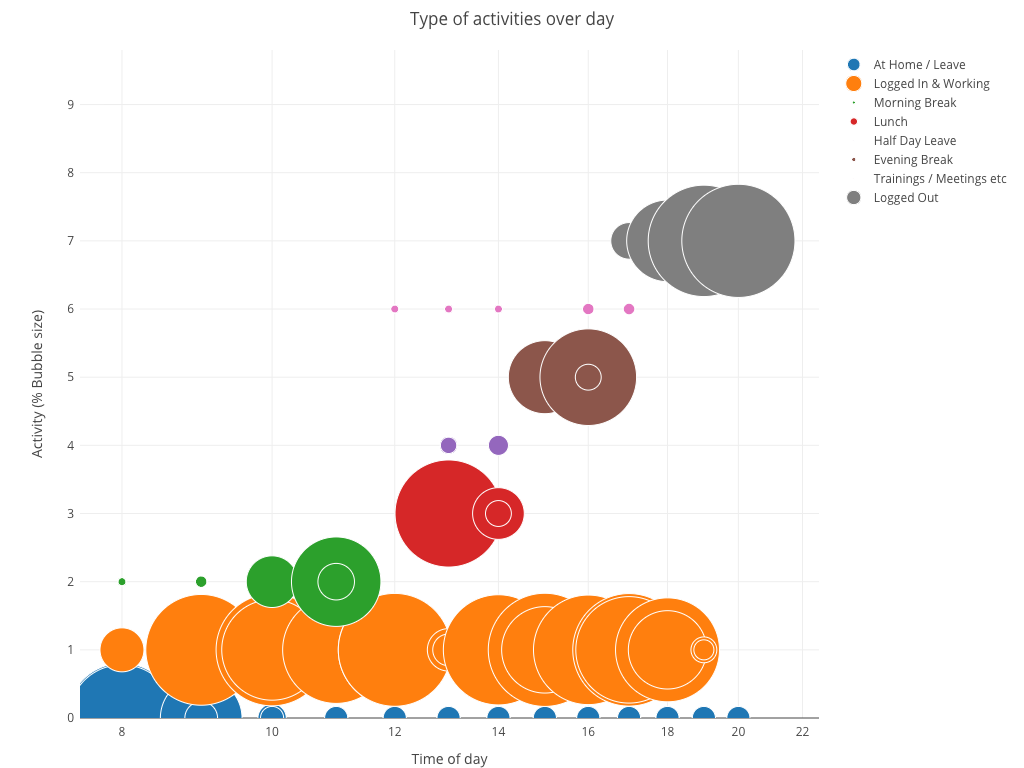
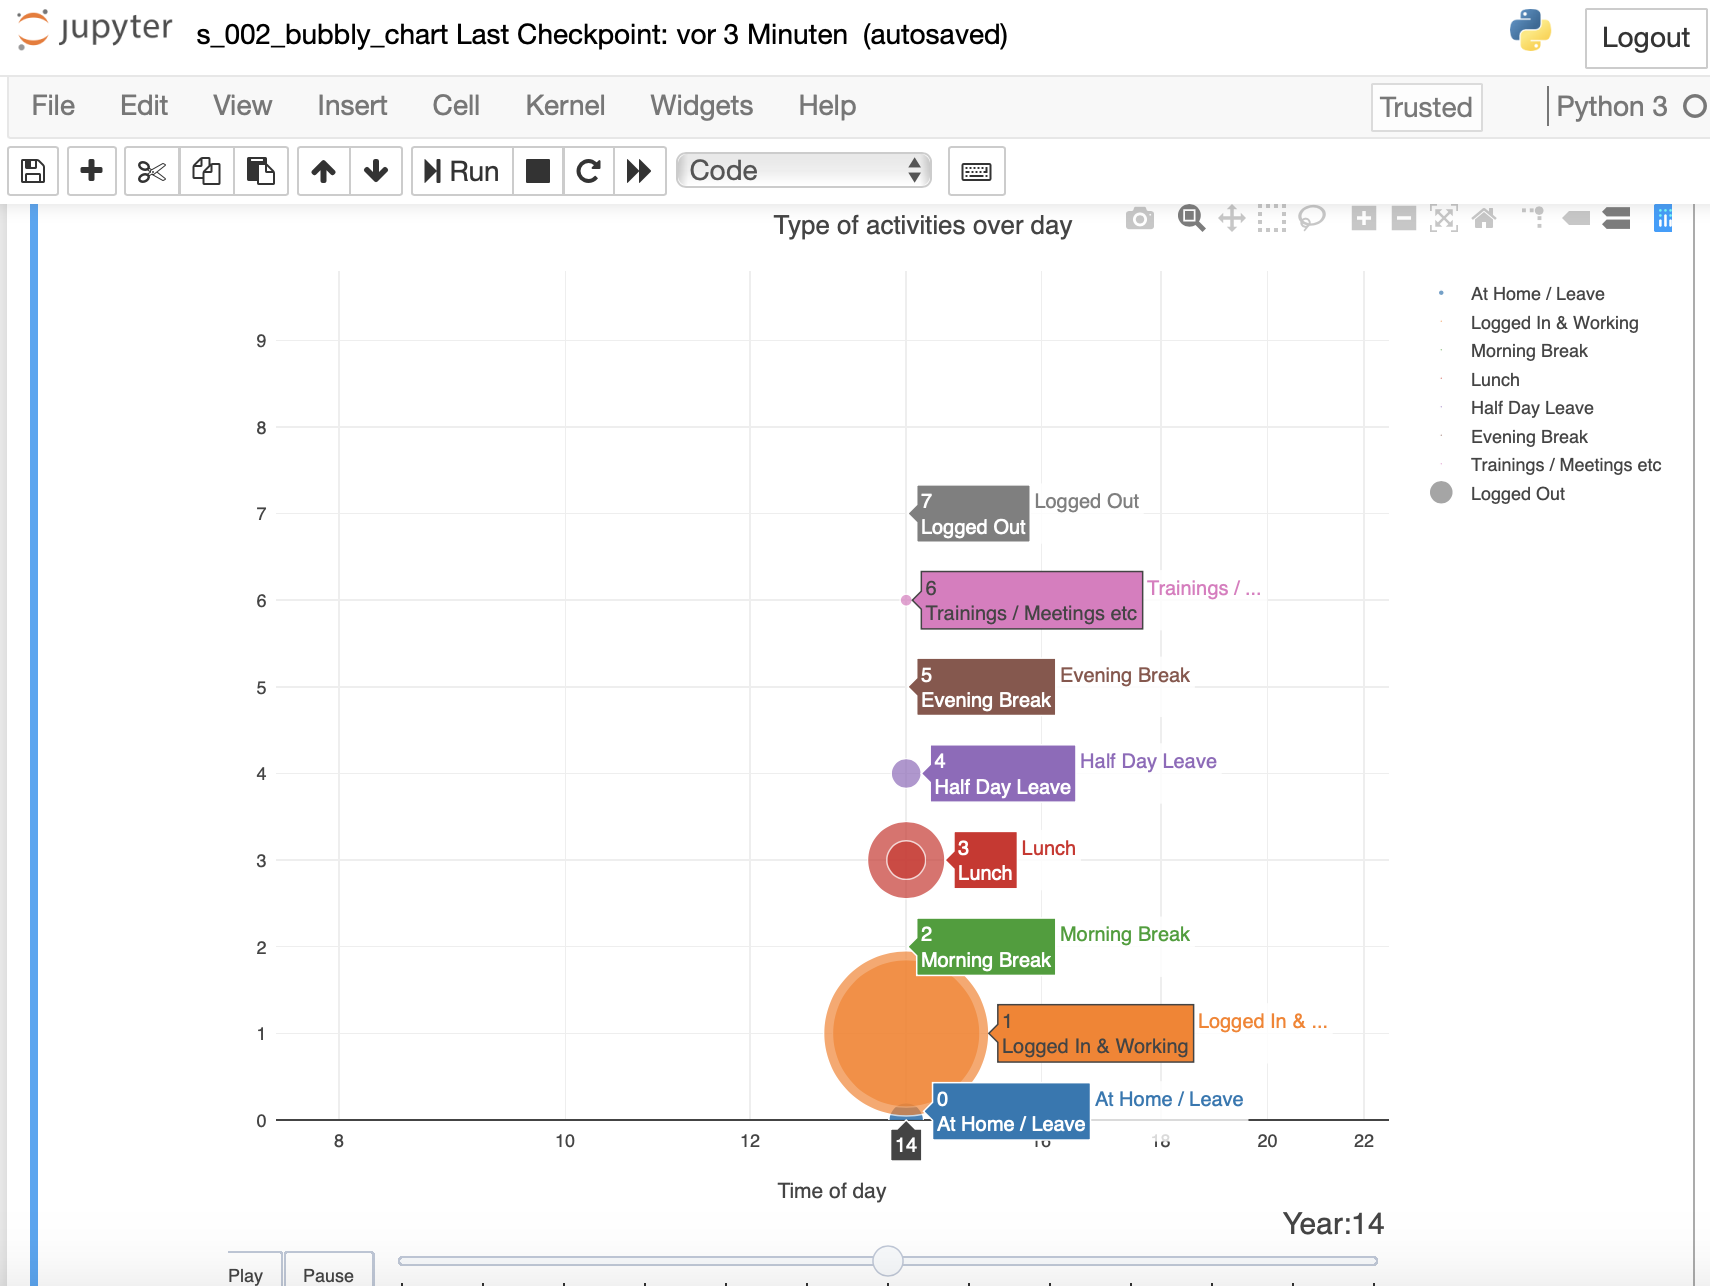
I need help in creating a moving bubble chart as shown in the link provided in the text file named “Example Chart Link” in the attached zip folder. I have found a tutorial on net on how to make this graph but the problem is it is prepared in Java and i don’t know anything about java.
Can you please help me in creating this type of chart in knime. I am ok even if you use Java related nodes (using the Java code given in tutorial) to create this sort of chart because what i wanted is to create this chart using knime. It will ok for me even if this can be done using R.
My zip attachment contains PDF file wherein Java code tutorial is given to make this chart. Also, there is a folder with contains source data for this tutorial. The text file contains the type of chart i am looking for and the excel contains my data to be used for creating this chart.
I would greatly appreciate your help.
Thanks a lot in advance.
Viz Files.zip (1.1 MB)