Need Solution

hi
I am new to Knime. Can anyone help me with this ?

I have the data shown for every min but I need to calculate the number of calls for every hour?
how to get the call count for every hour?

say for example, I have a data like
6:03:15 1
6:15:12 1
6:38:34 1
6:53:34 1

7:06:15 1
7:18:12 1
7:39:34 1
7:57:34 2

8:03:15 1
8:17:12 1
8:28:34 2
8:53:34 1

I need to get like

6am-7am β€” 4
7am-8am β€” 5
8am-9am ---- 5

Please if someone can help me. Thank You

Hi,

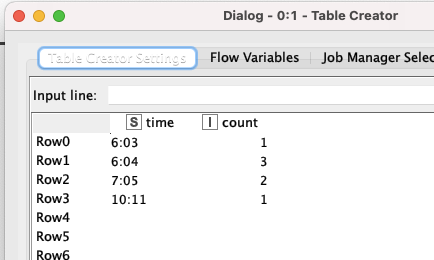
If it is not first format your data as time (String to DateTime node) then extract only the hours (Rxtract DateTime Fields node). At the end use GroupBy node

Regards

3 Likes

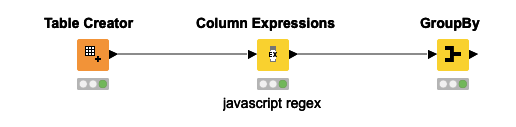
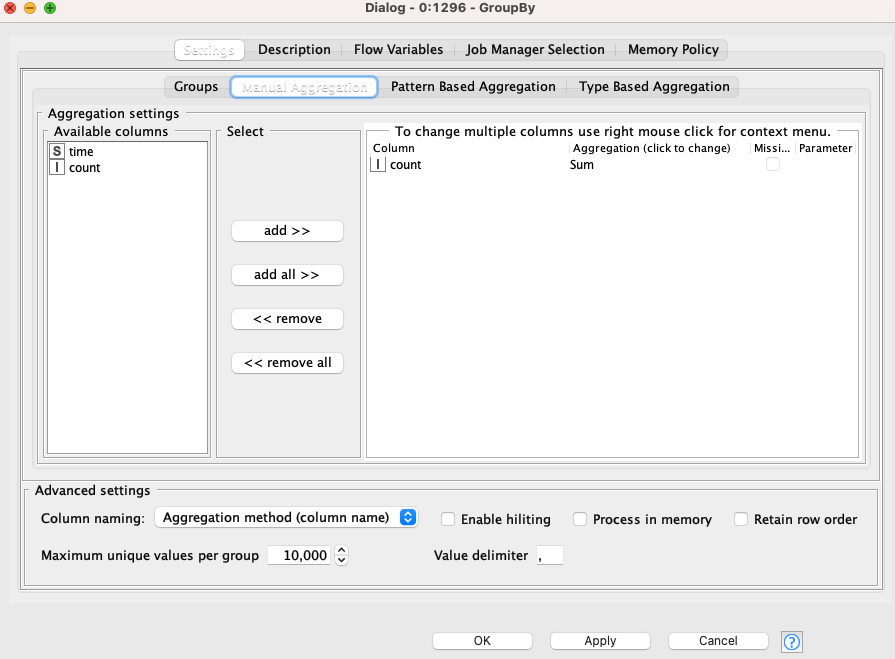
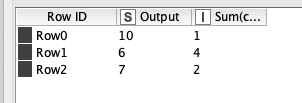
I like the solution posed by @andrejz, you can also use regex to extract the first digit from each of your times and then use groupby using a summation aggregation.

Regex is more complex, but can be handy for other situations.
Extract_Hour_Then_Groupby.knar.knwf (8.6 KB)

Screen Shot 2022-03-23 at 11.30.57 AM
Screen Shot 2022-03-23 at 11.33.08 AM


Screen Shot 2022-03-23 at 11.32.30 AM

2 Likes

hi,
My client is using the older version of KNIME (3.7.1) and haven’t got permission to upgrade. I am unable to use column Expression Node - JavaScript Regex.
Also I am able to do the above solution mentioned by @andrez.
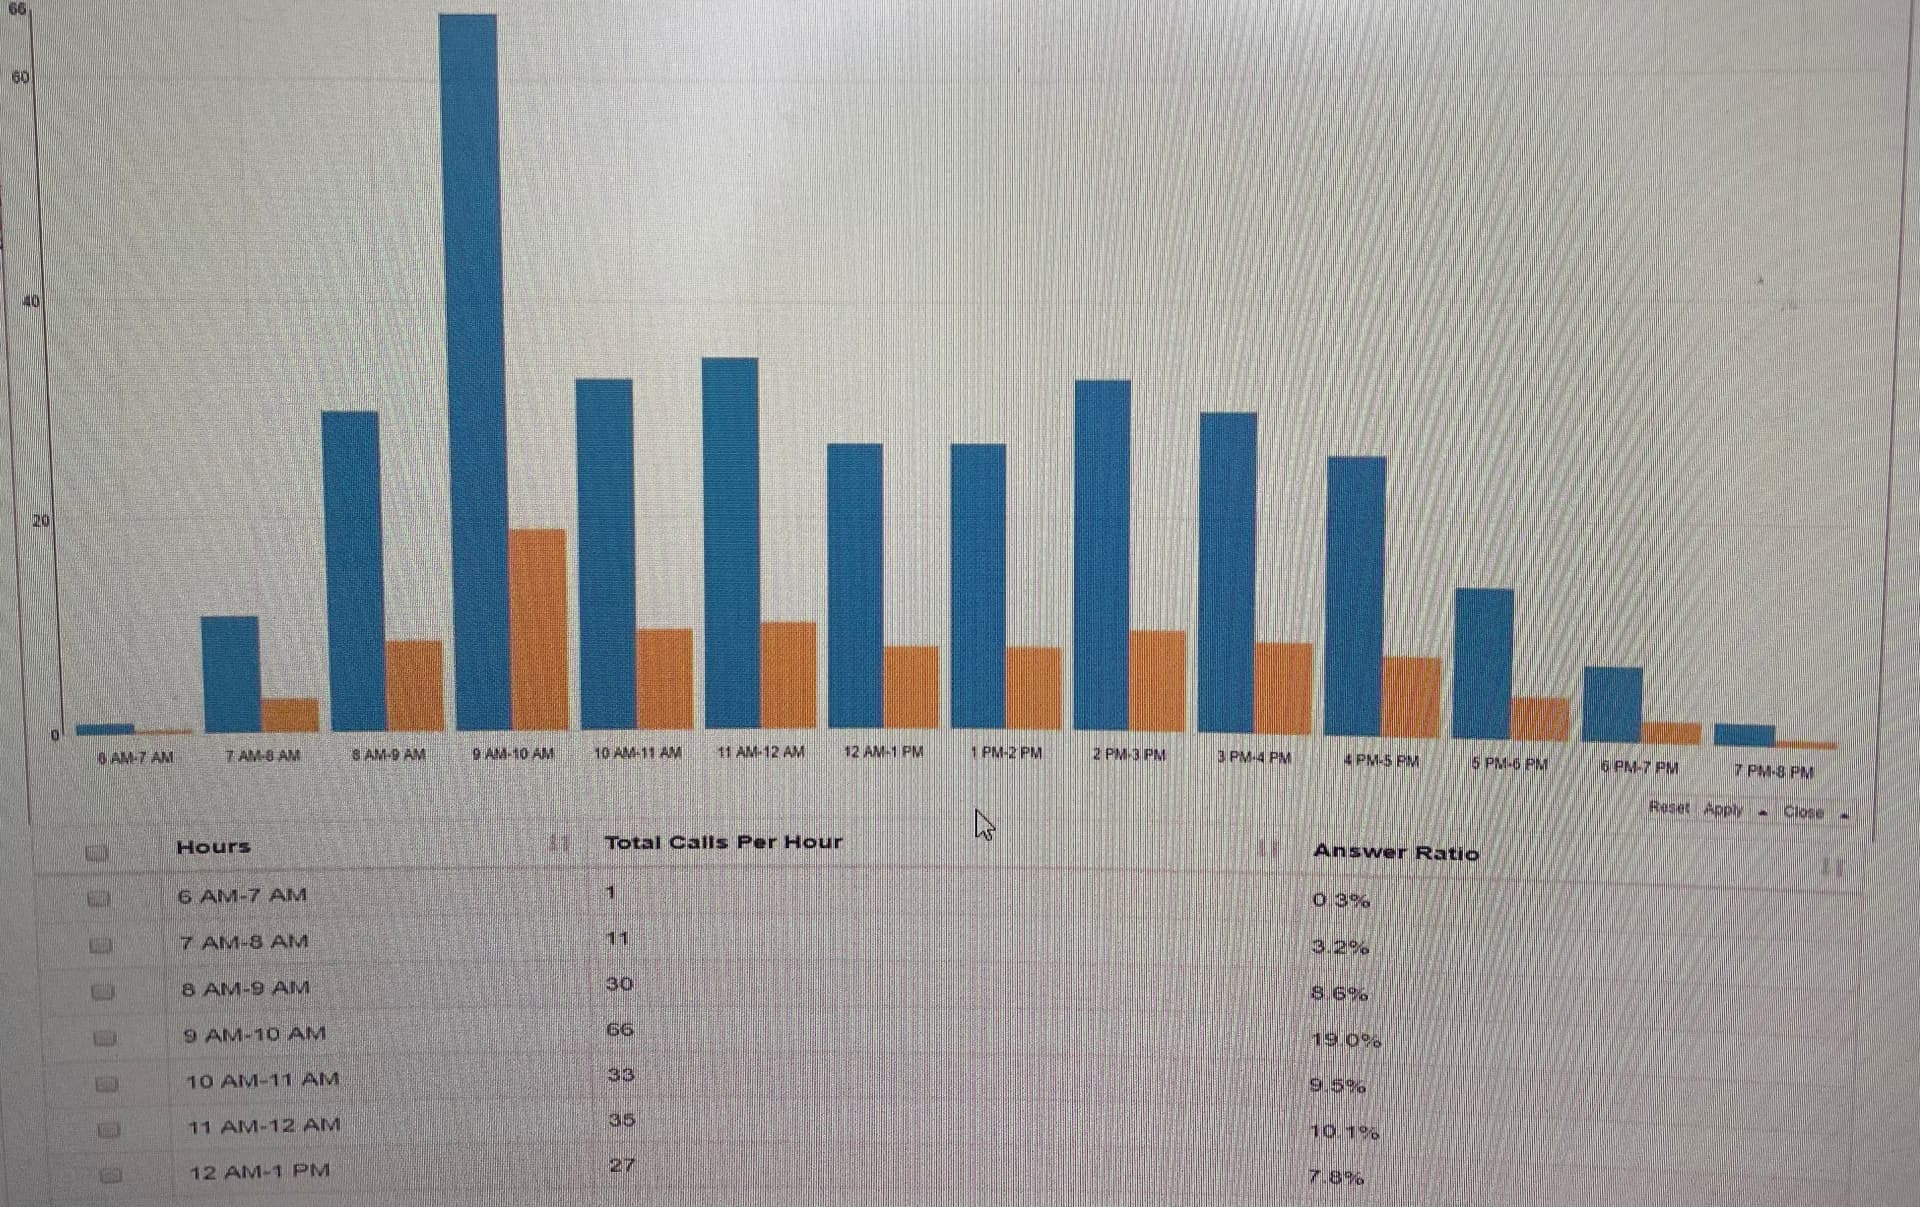
But do I need to use the loop to get the counts for the hours 6AM to 8PM or is there any better logic to work with.

Thanks @andrejz
Thanks @victor_palacios

@sophia_09 You can use cell splitter node and there split by β€œ:” so you get the hour. Then use the GroupBy node (as already mentioned before).
br

2 Likes

Thanks @Daniel_Weikert

I got the solution . I just used Extract date Time Field and Group by node to get the count by hours.
Thank you all.

1 Like

Hi,

If you want to group data (hours) in a range (for example 0-3, 4-7,…) you can use Auto Binner or Numeric Binner node to create this ranges.
This can also be done with the Rule engine node (in this case you can divide the day in night, morning afternoon,…)

Regards

1 Like

Thanks a lot @andrejz

Another Query: I used Math Formula Node to calculate Percentage. But to add % symbol to the numbers in that column?

I Used Java Snippet node to display the percentage. but it got displayed before the number like %15. But Need to display 15%

I uses Numeric Binner Node to group the data. it got worked. Thanks a lot

Hi,

You can also use String manipulation node … somethig like join(string(yournumbercolumn),"%")

Regards

1 Like

Its working. Thanks a lot @andrejz

Is it possible to display Data labels in the bar chart in knime?

Hi,

I use python nodes with plotly express to make different kind of charts.

Can you use python?


@andrejz : Thanks a lot for your great help.
As I am new to Knime I am struggling lot to find the nodes.
PFA screenshot of my model. Your timely help is appreciable.
I don’t have permission to install python in the remote desktop. but i will try the python option in my personal machine.

Hi,

Here you can find some examples and the code for bar charts using plotly express

Regards

1 Like

Thanks a lot @andrejz

This topic was automatically closed 90 days after the last reply. New replies are no longer allowed.