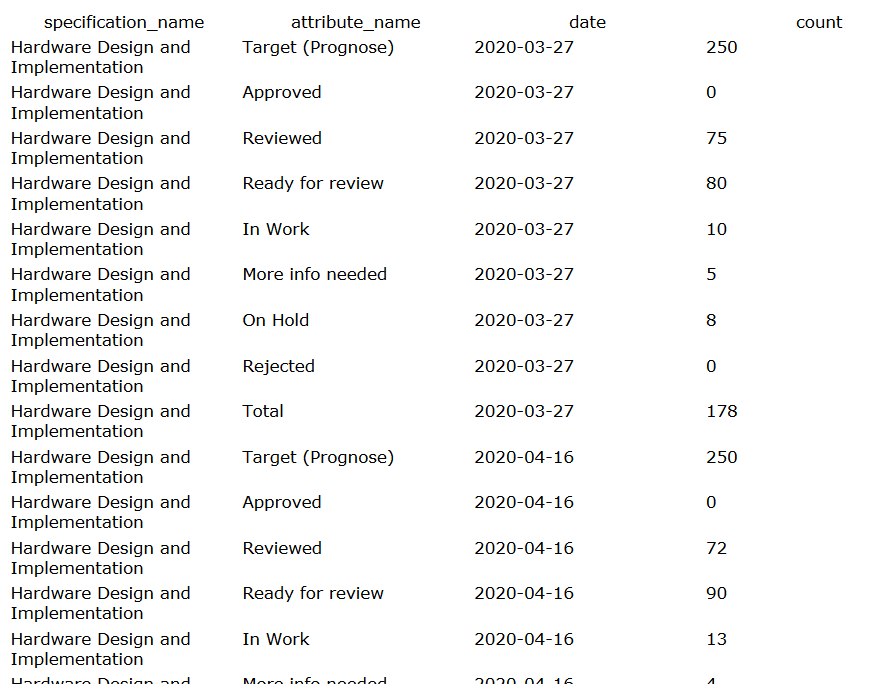
my data analysis in KNIME results in one table which is handed to the report. This table is something like an unpivoted 3D table, that consists of four columns logically being a group id, a row id, a column id and a value. The “length” of each of this axis is variable, so hardcoding was not an option.
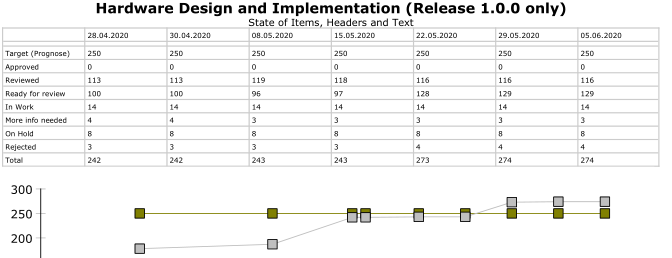
My solution for a line plot chart for each group was to nest the line plot in a table with grouping on the grouping column. That worked like a charm.
Now requirements have extended to also supplying a table of values next to the plot. I resorted to using a cross table as described in Getting Started with BIRT in KNIME | KNIME.
Sadly the cross table repeats using the data from the first group and does not switch to the according group like the line plot does.
What am I doing wrong or is there a simpler solution to this problem?
I don’t believe I have used this particular functionality in BIRT before, but maybe I can help out. Do you have an example workflow / dataset you can post that demonstrates what you’re stuck on?
(I’ll also tag @armingrudd here as well since he is a whiz with BIRT and has written some really useful blog posts on it.)
Sorry, the answer took some time, I couldn’t find the time to set up an example earlier.
This workflow is essentially what I need to do. The result of the second cross tab is correct but not what I need. I need the entries for Cat2 there which are 3,6,9 and 13,16,19.
I already found an answer on stackoverflow in context of BIRT saying to switch from “data cube” to “inherit from container” in the binding tab, but there is no such option.
Thanks for the example workflow. I played around with it and although there may be an obvious solution, I wasn’t able to find it.
Maybe a different approach would work better, instead of using crosstabs? We have a step-by-step guide on displaying filtered, paginated data by group at the link below, in the Advanced Workflow section:
I used Grouping Method 2 and played around with it for a while now. The approach works but lacks the readability of a cross tab and wastes a lot of vertical space. Both points to which I could not find a way around. I get about four pages of this with nested tabs: