Hello,
I am struggling trying to do this probably really simple task with knime.
I’ve got a datasource done in this way:
MAIN_CATEGORY,SUB_CATEGORY,NAME,SCORE
HIGH,HA,A1,15
HIGH,HA,A2,10
HIGH,HB,B1,20
HIGH,HB,B2,40
HIGH,HB,B3,22
LOW,LE,E1,14
LOW,LE,E2,12
LOW,LE,E3,16
LOW,LF,F1,50
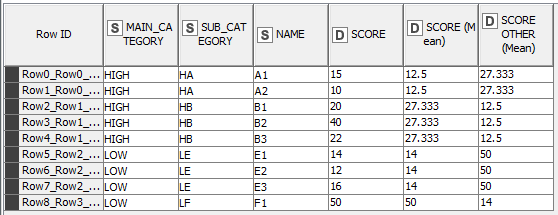
and I need to obtain the result here below
MAIN_CATEGORY,SUB_CATEGORY,NAME,SCORE,OTHER_MEAN
HIGH,HA,A1,15,27.33
HIGH,HA,A2,10,27.33
HIGH,HB,B1,20,15
HIGH,HB,B2,40,15
HIGH,HB,B3,22,15
LOW,LE,E1,14,50
LOW,LE,E2,12,50
LOW,LE,E3,16,50
LOW,LF,F1,50,14
where in the last column there is the mean of scores of the records belonging the same MAIN_CATEGORY but different SUB_CATEGORY than the one considered.
Eg. the value 27.33 in these two records (same main category HIGH and same sub category HA)
HIGH,HA,A1,15,27.33
HIGH,HA,A2,10,27.33
is the value of the mean of the scores (20, 40, 22) of these 3 records (belonging to the same main category HIGH, but different sub category HB)
HIGH,HB,B1,20
HIGH,HB,B2,40
HIGH,HB,B3,22
How can I obtain this result?