I currently have a difficult task, or to difficult for me.
I’ve got a table with every orderposition of some customers and some periods of time.
These are the basis of a new table, where I want to analyze the buying behaviour.
I’ve already grouped the necessary values, like number of customer online, number of customers total and so on.
But now I need to create a new table out of these whole aggegated values like this:
RowID | Specific Name | Period of Time | Number of Customers | Number … offline | Number … online | Amount of articles …
Is there a way to do this?
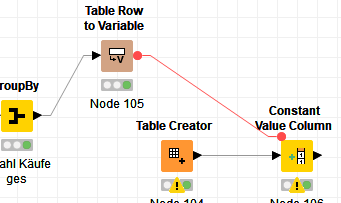
I’ve already tried sth. like that:
But the created table is always empty or every single row in the column gets the same value.
I think you might need to use the Joiner node to join your aggregated values back to the original table, but it’s hard to tell just based on the screenshot. If you can post an example workflow with dummy data, I’ll take a look at it.
I looked at your workflow and see that you’ve implemented a lot of joins and grouping. Did you get where you’re trying to go, or are you still trying to do something else?
I get the feeling that you still want to generate a single table with your aggregated measures all in one place. Is that right? If so, can you give an idea of what you’d want that final table to look like? I think you’re probably close, you’ll just need some additional joins and/or concatenations to get there.
sadly I didn’t get further than that.
You’ve got the right feeling for the final table.
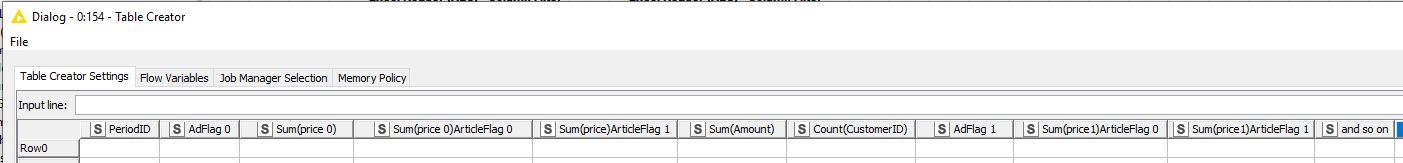
I’ve also included a look-alike into the example workflow. It’s on the right side, the single “table creator”.
If you look inside the configuration, you can see a part of the final table header.
I need one row per period which is defined by the “date&time-based row filter” and the aggregated values from this period complete the table.
The optional goal is to …like loop through the workflow? With a new defined period and a new row inside of the final table, without deleting the old one from the first period.
I’m afraid I’m unable to take part in a KNIME workshop for a better understanding. So I have to do everything with learning by doing.
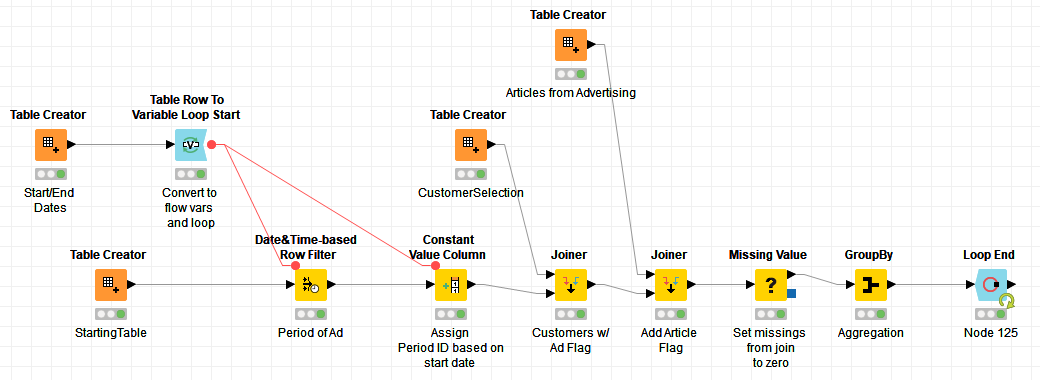
Adding flags to the input tables for Customers and Articles, and then performing right outer joins. This way we keep all of the data in a single table as we go.
Doing the aggregations in a single GroupBy node. This may not be exactly what you want, but I hope you can tweak it from here to get closer to your preferred format
Implementing a loop structure so you can run over multiple date ranges, as specified by the additional input table.
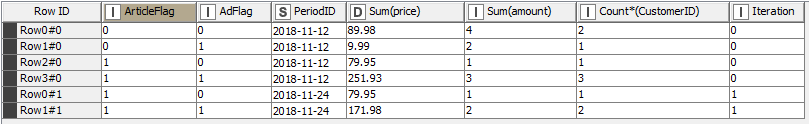
Results look like this, where the ArticleFlag and AdFlag variables are just True/False binary indicators:
thank you.
That looks very good to me.
I think that’s the start I needed for a better understanding.
Again thanks to you. I’ll try to expand that and will get back to the thread if there is still a problem for me.
I’m back after the Holidays and so on
And back to my Workflow…
Do you think it’s possible to get from your final table (like the one in the screen) to a table which is grouped by the Period ID, but without aggregating the rows?
Like in my Screen one row divided by “AdFlag 0” and “AdFlag 1”
It’s not immediately clear to me from your screenshot exactly what you want do to. That said, if you take out the last GroupBy in the sample workflow I provided to remove the aggregation, and use something like the Column Expressions node (or a series of Math Formula nodes) to do your calculations downstream from the Loop End, maybe you can get there.
thx for your ideas. For now, I’ll try to get everything into one row with the help of excel.
Just one question about your sample workflow for a better understanding. It really helped me alot.
But think about a customer who walks into the store and buys two articles. One from the advertisement and one regular. In my understanding, the customer will be in the row “AdFlag = 1 & ArticleFlag = 1”, as well as in the row “AdFlag = 1 & ArticleFlag = 0”. So the customer will be doubled with the GroupBy “Count CustomerID”?
In my sample workflow, regardless of the combination of flags you use in the GroupBy node, the total count of customers is the same (10). So this is a probably a case of me not interpreting your data properly to begin with. Feel free to do away with the flagging if it doesn’t apply.
do you know if there’s an option to safe the outcomings of one loop, even if I restart the loop with other inputs (like other articles and another date range)?
For now, if I change these inputs, the loop would be reseted and it overwrites the old outcomes instead of concatenating them with the new ones. I’d like to get every outcome in one excel sheet afterwards, like a “master-sheet” for a more presentable sheet (report) in the same excel file.
yeah that could be one option and I’d get a loot of sheets in my excel, better said one sheet per campaign. But I’d like to have it all in one.
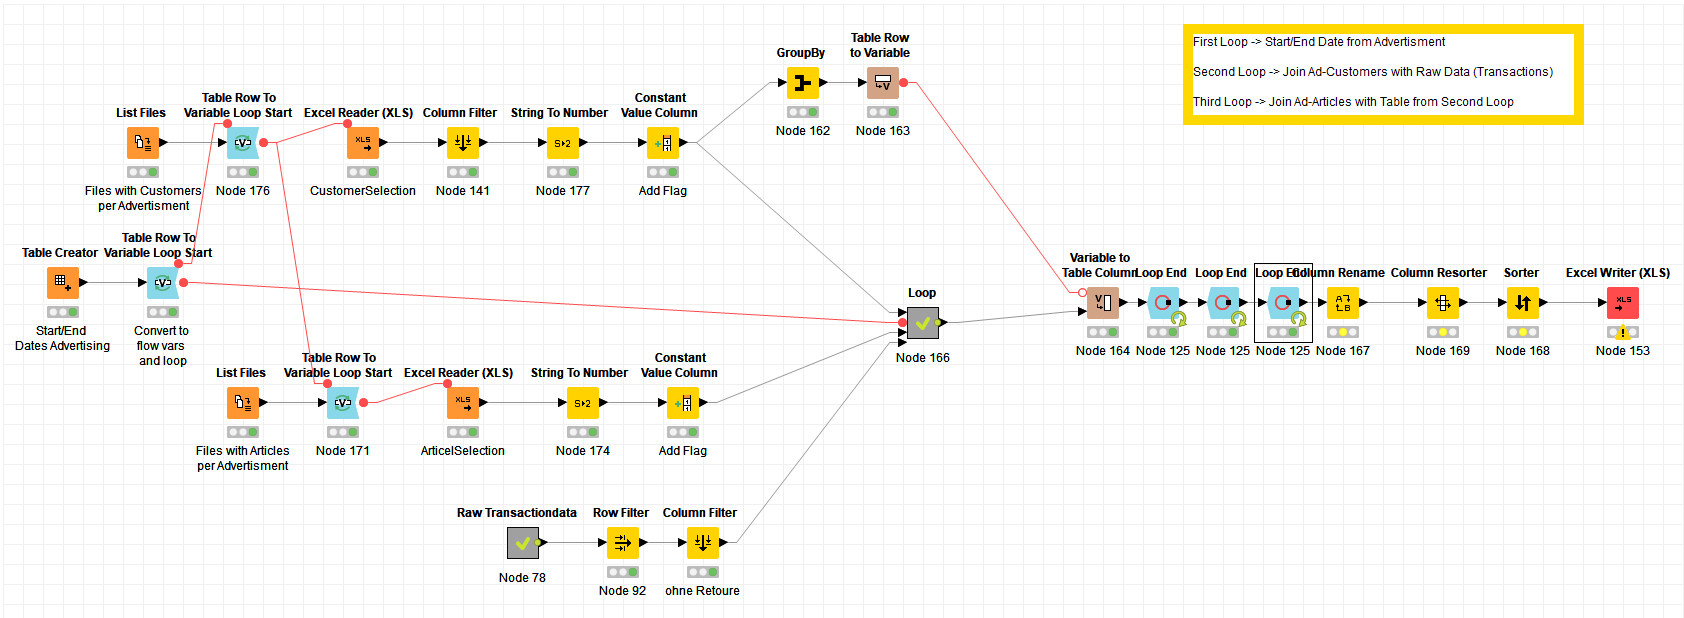
I’ve found another way with “List Files”, but I don’t know how to coordinate three loops.
In theory the workflow would loop through each campaign period (and the associated custome & article files) and concatenate every outcoming in one file at the end.
It works til the joiner nodes, where the loops would “meet” each other. I know that there have to be the same amount of loop starts & loop ends. Also the loops have to run simultaneously.
Do you think that’s possible at the current state of KNIME?
Have you thought about nesting loops within each other? For example, have an outer loop that iterates over the campaign period, while an inner loop iterates over customers?
Yeah for sure and I already tried it.
But in this case the workflow would do the following, doesn’t it?
The outer loop selects the first campaign period.
The next (customer) loop selects the first excel.
The last loop (article) selects the first excel.
The workflow goes to the end and begins to loop from point 3, through all excel files with articles
With the 4. point done, it begins to loop through all customer tables & all article tables (third loop).
With the 5. point done it begins with 4. while selecting the next campaign period, and so on until every period is done
After that I get a table with 32! rows per period (96 in total) instead of the exact amount of 4 rows per period (12 in total).
Or is there another way to nest them? I’ve attached a screen from the nested version (without the loop-view).
At this point, the workflow is sufficiently complicated that it will be hard to debug using screenshots. I would need to take a close look at exactly how the loops are executing. Are you able to upload it, or is your data proprietary at this point?
I’ve attached a GoogleDrive-Link (Workflow and some lists in sub-folders, sorry but my admin blocked uploading excel-files…) where I’ve changed the whole data into dummy data . It was quite a lot of work, but I think this will show you the problem at the last loop end. It would be correct with four cases per campaign (ArticleAd_Flag & CustomerAd_Flag):
0 & 0 / 0 & 1 / 1 & 0 / 1 & 1
Based on what I can see, I think the key lies in determining why the dimensionality you expect in your final loop (12 rows, 4 per period, each row representing a combination of ArtFlag and AdFlag) doesn’t match what you actually see.
To start debugging this, I’d take a look at JUST the inner loop, which is producing unexpected dimensions (you expect 4 rows here, but actually see 8). There are two things going on:
Not all combinations of ArtFlag and AdFlag are always present, leading to fewer rows than expected
The loop is iterating over each article (C1, C2, C3) and producing results for each, leading to more rows than expected.
The first item I don’t think is actually a problem - if all combinations don’t exist, that’s just the nature of the data. The second item probably is an issue. Should you be doing some additional aggregation to combine the results after the loop? That’s my guess.
If you can figure out a way to fix the expected dimensions of the innermost loop, I think fixing the other loops should follow, since it’s probably the same issue at play.

 Feel free to do away with the flagging if it doesn’t apply.


 I would need to take a close look at exactly how the loops are executing. Are you able to upload it, or is your data proprietary at this point?