Dear Knimers,
Is there a specific node (or component) for dealing with time series correlation between pairs of variables? I was told I should search for a co-integration analysis for such non-stationary series…
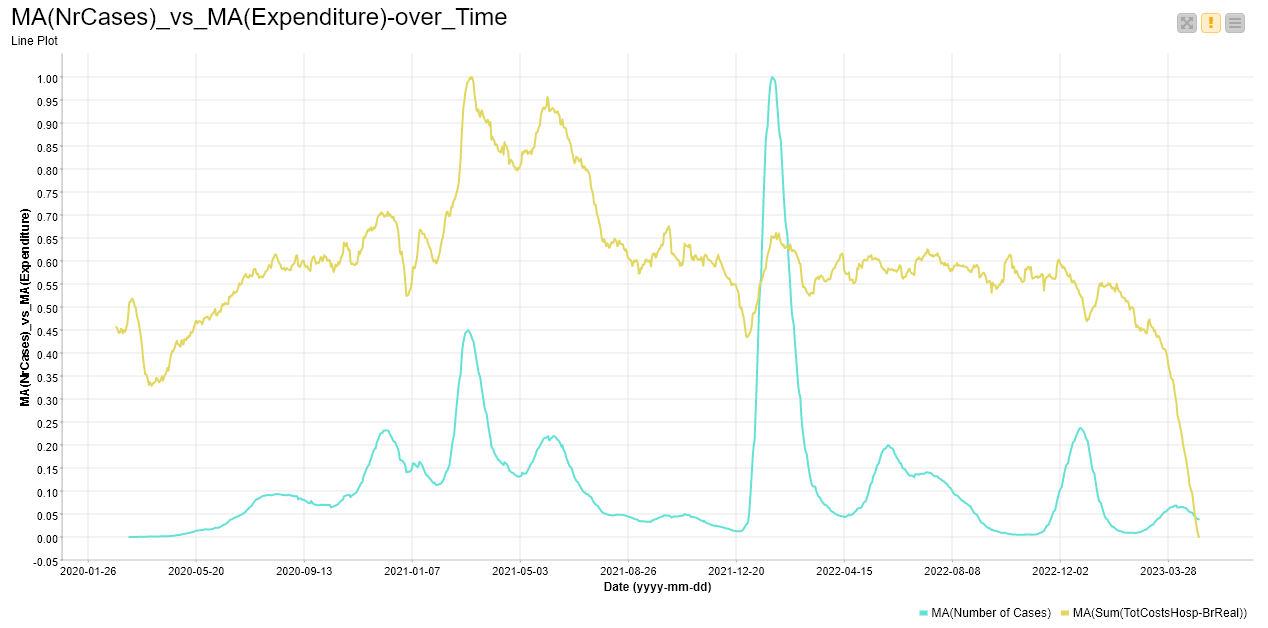
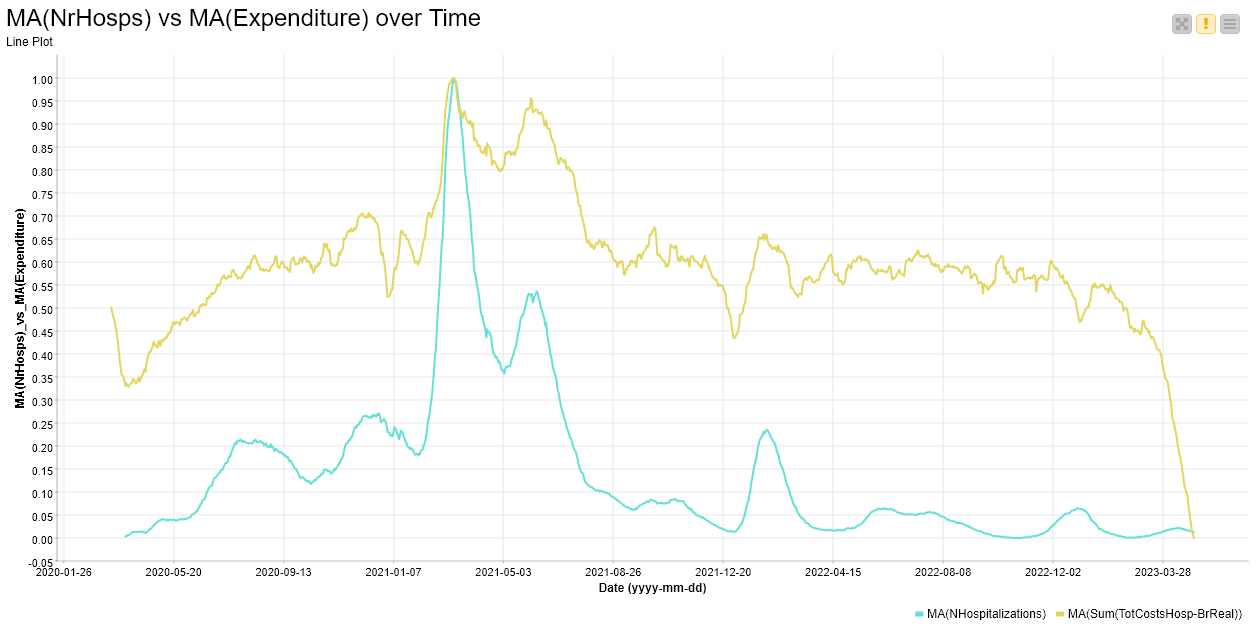
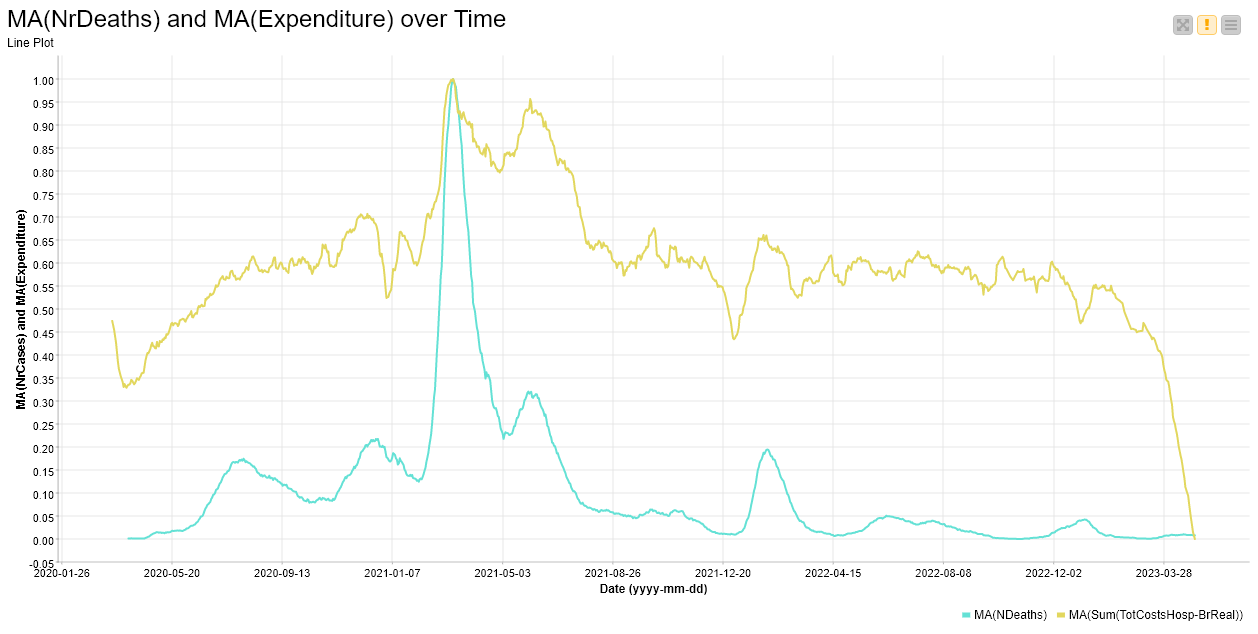
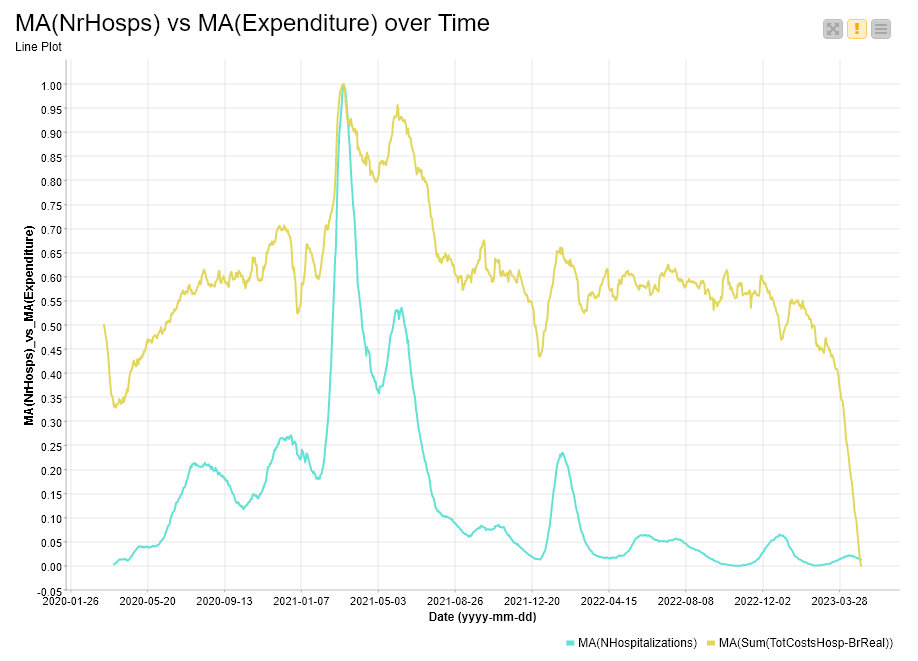
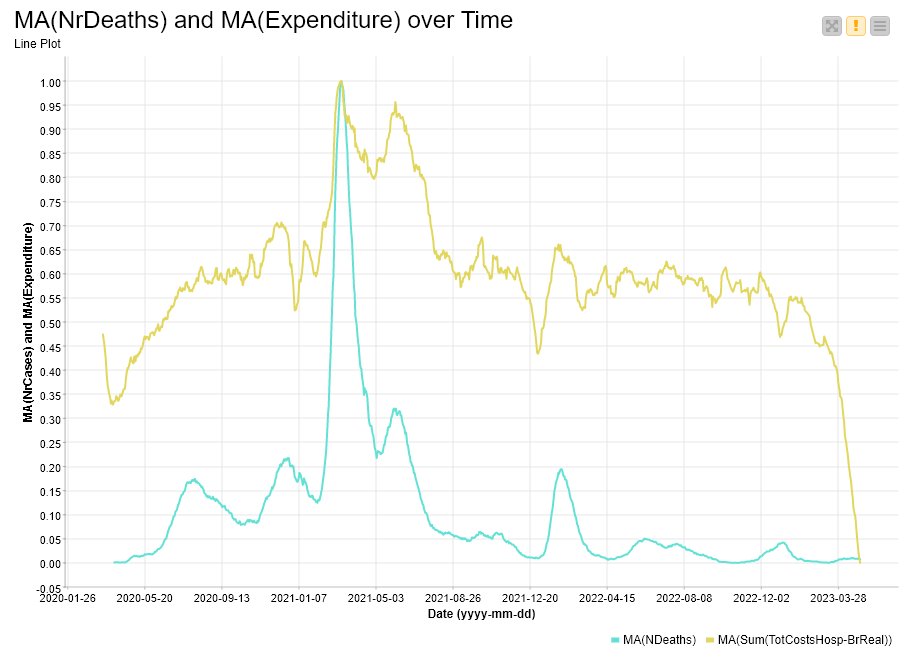
I have these three graphs (with moving averages (MA) of normalized COVID data):
If needed, I could post a Knime table with the data used for building these charts.
Can someone help me?
I deeply thank for any suggestions.
B.R., Rogério.
Let me ask internally to see if someone can help. In the meantime, it would probably be helpful for you to post an example KNIME table - maybe even your workflow in progress, if it’s not using confidential data?
Hi, @ScottF ,
Thank you for helping me once more – you1ve already given me a bunch of precious tips in former works, while facing some difficulties in the research of my master’s course…
And yes, I can post here some tables and graphs that might help you all to understand what really is my problem. BTW, data are public.
I need to find any correlation between each of the three selected Covid variables (Number of Cases; Number of Hospitalizations; and Number of Deaths), willing to compare them with the total hospital expenditure. Thus, I got three tables, with their values normalized ([0; 1]) and taken by respective moving averages (14 d.).
These series don’t look like stationary ones, nor do I see on them any “time lag” in each pair of variables.
I was told (by a statistician who (unfortunately) does not know Knime) that I should try some co-integration (tests of Johansen, Engle-Granger, and Dickey-Fuller (this latter for stationary series, which does not seem to be the case), or any other…). I found nothing exactly of the kind in Knime, yet. Notwithstanding, my whole work lies on Knime resources. I am also trying ARIMA, though I think there is someone there (in Knime Team or in the Community) that might help me on this issue. This would be my first approach to ARIMA…
Thank you, and I also thank anyone who gives me a better clue of what should I try (among Knime resources) in order to transform them and get some colinearity between the variables.
All the best.
Rogério.
Hi @rogerius1st,
Cool to see more time series work being done on the forums!
I agree that co-integration testing is a good place to start, this is useful for exploring their long term relations to each other as an end goal or as preparation for forecasting.
There are a couple ways to do that but they all require scripting from the KNIME side. However the Python extension gives the options to use a bundled environment that comes standard, and that environment has the statsmodels package which has many time series functions including a cointegration test, you may need to try that:
Hi, @Corey,
So good to read your answer and suggestion… Thanks for that.
As in your first “gut feeling”, my end goal originally was to investigate relationships between these time series, searching for eventual correlations in any pair of them, for I wanted to know the weight of pandemics into the total hospital expenses in our Brazilian public health system (for my research and I are both Brazilian). And, as in your second thought, I wished to build (something like) a tool to forecast future expenses in a large health system, based on selected variables of an eventual future similar disease (of anything of the kind).
Unfortunately, I have no training in Python. Thus, it would be a tough task (for me) to work in a Knime workflow with coding into the Python extension… Indeed, I naïvely expected there were some dedicated nodes (or components) in Knime for working with similar tasks (on time series), but with no (or low) coding. My first intuition for trying ARIMA was in the latter intention that you suggested (which is to forecast (under a predictable accuracy level) future financial consequences of a similar health disaster such as Covid-19), based upon selected instant values of selected variables. But I faced some issues in choosing and testing several ARIMA parameters (for I had no experience with this particular analysis). Which values (or interval of values) should be tested, in order I could find the best correlation coefficients (if any exist)?
I had the feeling (based only on the visual analysis of the graphs), that I didn’t need to search for eventual lags (as in the stats models link that you recommended) because the “peaks and valleys” of both variables in the three curves seem to coincide over time. Does it also seem so to you?
Thank you, if you could help me any further so that I can progress in my analysis. I guess that even a simpler manipulation, or a shallow handling of those data (provided, of course, it led to plausible coefficients), could satisfy my end goals.
Wish you all the best.
Rogério