i have a problem with transforming numbers into the right format from a given table. The values are given in 5 different forms over multiple columns and are not true, due to reading in the data with the excel reader node (there are multiple different table with different table headers in one sheet). The numbers are given as follows:
i) 5.945218603E7 should be 59452186,03
ii)1.600,00 should be 1600,00
iii)50800.5 should be 50800,50
iv)2300 should be 2300,00
v)450.800,20 should be 450800,20
I have not yet found a way to transform the values, so all of them will be right. (I can not upload the excel file, due to it being confidential.)
I’m not sure if I understand you correctly with the examples you give. Main reason for this is that within Excel one can apply formatting to cells (so what you see, eg. a rounded number, might be different from what Excel will use in calculations the raw number with all digits). In KNIME the formatting mainly depends on the type of a column. You can see the column-type as a small icon in front of the column name. This is either a D, L, I or even S in a small square for resp. Double, Long, Integer of String.
As long as the column type is as you want it to be KNIME internally will use it as you want.
In the Excel Reader node you will see in the configuration those icons in the preview too. If these are not as you expect them to be, you can go to the Transformation tab in the configuration and change the type for each column separately. As you can imagine if you try to enforce impossible transformations (like plain text into numbers), this will result in errors. But e.g. a transformation from an integer into a long, or a long into a double is very well possible.
For me the most important of numbers in a column is whether the type is correct. If e.g. the number shown is 2300, but the type is double, you know internally it is not treated as an integer.
How KNIME shows these numbers in output data (of a node) and how you want those numbers to become visible in a report or some visualization is a completely different story.
If you want numbers to be rounded you might want to use the Round Double node, but once they are rounded you cannot go back to the original values. So postpone these actions till the last moment in your workflow.
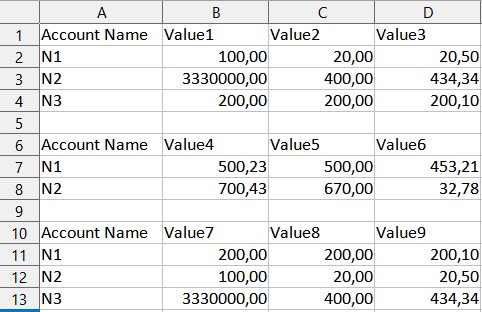
thank you for your really quick reply. I think my post was a bit misleading, so i made a quick table which should show my problem. The table shows the data, in which format it is given by a system. So determining a specific column as long, integer or double ist not possible, as it has to be a string. When reading in the data, the values are transformed as seen in my previous post.
Ah, so you have multiple smaller datasets contained in one Excelsheet. Each with their own headers in it which force these columns into strings always. It would have been nice if those smaller datasets where placed on separate sheets (or even files).
If there are a few of those datasets you could try to use the “Sheet area” part to focus the reading on one dataset and use multiple Excel Reader nodes for each dataset and join or concatenate them afterwards.
And if there are too many small parts you might have to look at some logic for those smaller datasets. E.g. is there a fixed number of rows or always an empty row between them?
If you explain the logic I could try something to get an example workflow which applies to this logic.
there are too many datasets to use individual excel readers unfortunatly.
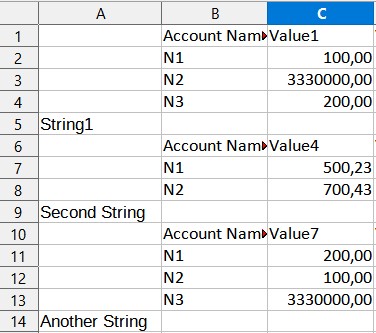
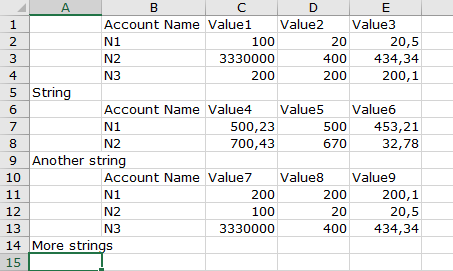
The number of rows is always different and there are no empty rows in between, but in the first column, there is a cell with a string value after every dataset. The other cells are empty. Those strings do not have the same content. Something like this:
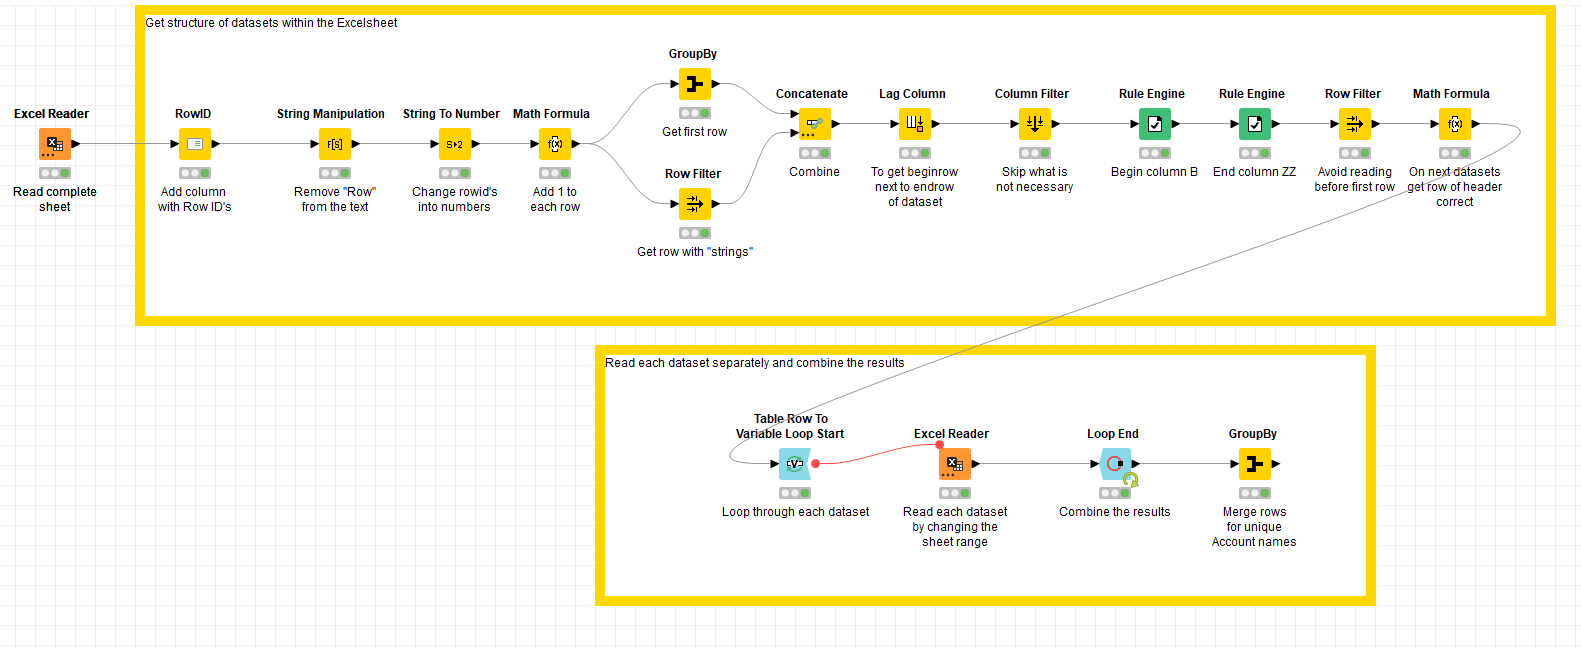
The workflow is attached here 34755.knwf (51.3 KB)
It relies on the structure provided by you for strings in column A followed by empty columns (which can be ignored) which split the different datasets. And it relies on a string (in column A) below the last dataset.
Maybe you have to tweak the workflow if the logic is slightly different after all.
you can even replace entire logic with one Column Expressions node (plus Row/Column Filter of course) but seems your solution is still faster regardless on number of nodes used 34755_colExpr.knwf (58.0 KB)


 )
)