I am trying to find out which articles have been commonly bought together from an Excel file listing sales. The end goal would be to have the top 3 of “often bought with” for each article, similar to what you often see in web shops.
In my sales Excel file, I have the ReceiptNrs and the ArticleNrs. Each Row has both, so if I buy two articles together, I have two rows with the same ReceiptNr, but different Article Nrs.
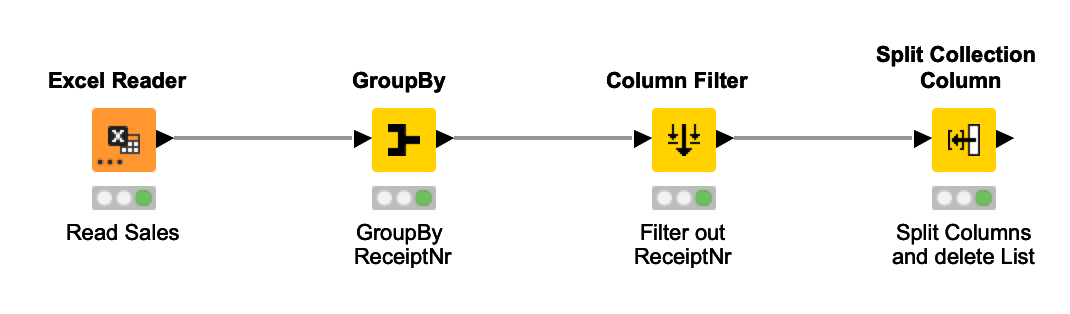
I started by reading the Excel File, using GroupBy ReceiptNr to get a list of all the articles being sold together during one particular purchase. I then remove the ReceiptNr and use Split Collection column to end with the result shown below. The idea was to now start from Split Value 1 to Split Value n, taking the ArticleNr of 1 and combining it with the other Split Values ArticleNrs together with a count of how often it occurred. Then I start from Split Value 2, go to Split Value n and do the same thing, and then for each row.
Can somebody help me how I get to my final goal with KNIME?
Hi @ChrisHill , I’m kind of thinking out loud here,
but if you take a step back I think there is an easier way to get your combinations which you can then count… If you take your excel data table and join it to itself with a Joiner, using just ReceiptNr and then feed the result of that to a Rule Based Row Filter and remove all the rows that have the same articlenr from both sides of the join, (ie remove rows where articleCol1 = articleCol2 ), then what you’d be left with is a table of every time each articlenr was purchased with each other articlenr.
You could then group that by (articleCol1, articleCol2) returning a count and you now have a count of occurrences for each article (artcileCol1,
articleCol2) combination.
If you then sort those by articleCol1 and the returned count , you can then rank them and finally filter so you just have the top three for each article.
Something like that anyway… if that doesn’t make any kind of sense let me know and I’ll try to build it when i have a chance.
@ChrisHill in addition to the suggestions already made you could take a look at these examples of rule learning and sort by support of the rule. But also some simpler count might help
Hi, thanks everyone for the great suggestions! I eventually decided to use Python instead of KNIME, since this was much easier for me.
The code below gives the ArticleNrs of up to six (could be less) ArticleNrs that have been bought together with the initial article, but at least twice together, to get rid of some outliers or articles that have little sales.
The part until df.dot gives a matrix of all sales, so rows and columns are ArticleNrs and the cells are how often they have been sold together.
The lambda takes each row, sorts them according to the sales and then takes a list of the column names of these (i.e., ArticleNrs). The first one is discarded, since it’s always the initial ArticleNr. Then the series is transformed to a data frame, the new column named and the index of the ArticleNr replaced with an actual index, to have the ArticleNr available again in KNIME for later.