Thank you, @Maarit!
I will look into the book as well.
Best,
Haystack
Dear @Maarit, and Knime team, and all the time series users,
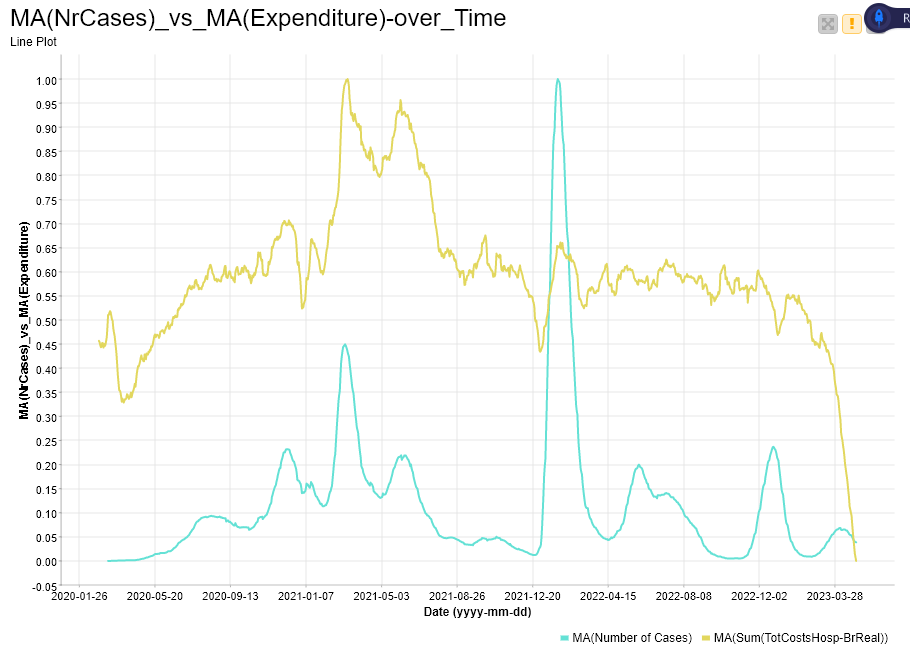
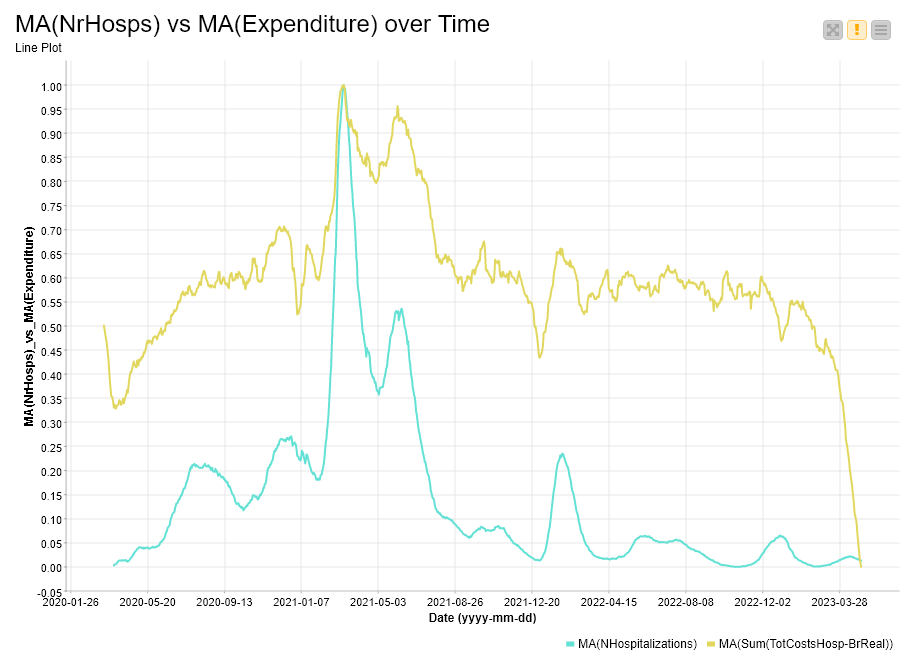
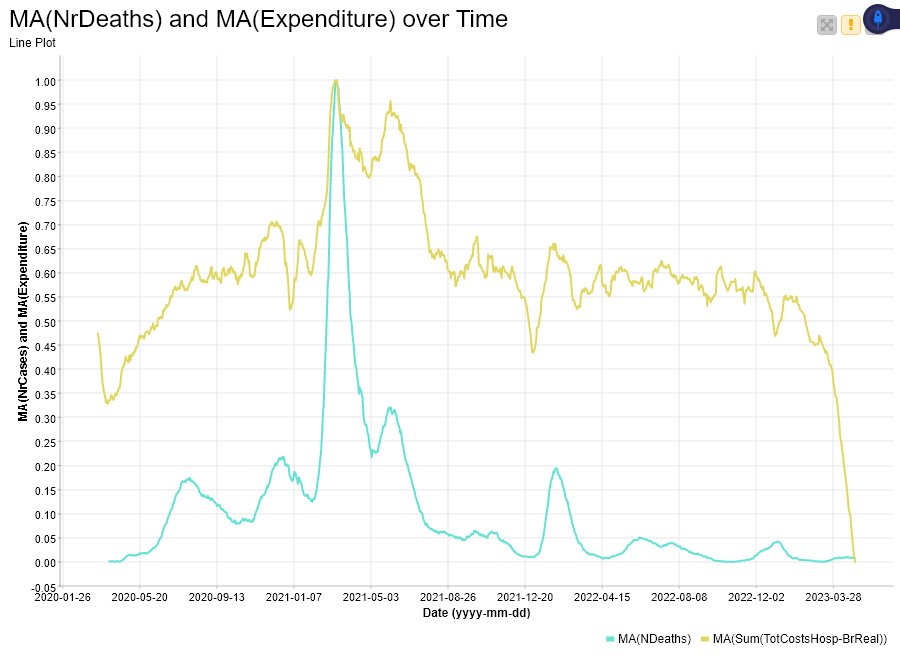
I am facing an issue with my time series. I am comparing (or trying to compare) two kinds of data and got these three tables and the corresponding plots (after grouping by date, taking their moving average, and normalizing the data):
I need to discover if there is a real correlation between each pair of variables and then measure such correlation. These variables seem to be “non-stationary”, but I don’t know how to check it. Thereafter, I should quantify the relation between them (or eventual dependency) of the latter variable (the hospital expenditure) as a dependent variable relating to one or more of the three other independent variables (NrCases; NrHospitalizations; NrDeaths).
I was told that I should try to apply one or more of the “co-integration tests”, such as Engle–Granger or Johansen. Or the Dickey-Fuller, if the series were stationary.
Are there such nodes (or components) in Knime? Can someone help me with this task?
Thank you all for any help.
Wish you the best.
Rogério.
Dear KNIME Team, i have a question. In TSA Modell, i want to have the churn effekt. Is there some prediction model where is also churn % included? Which node would be good for this issue?
Thanks a lot.
Regards,
Hello everyone,
I created an environment in Anaconda following the instructions in the course pdf. Then I activated it to install Keras and Tensorflow; now, when I go to File>Preferences>KNIME>Python Deep Learning, I receive the message:
Library oonx_tf is not properly installed. Details: No module named ‘keras.src.engine’
How can I solve it? It seems to be a matter of version incompatibility of Keras and Tensorflow.
Thank you.
Carlos