Dear Keerthan,
Thanks for your direct (and detailed) answer. Thanks for your comments, and special thanks for the (uphill) task you probably had while working on my KNWF.
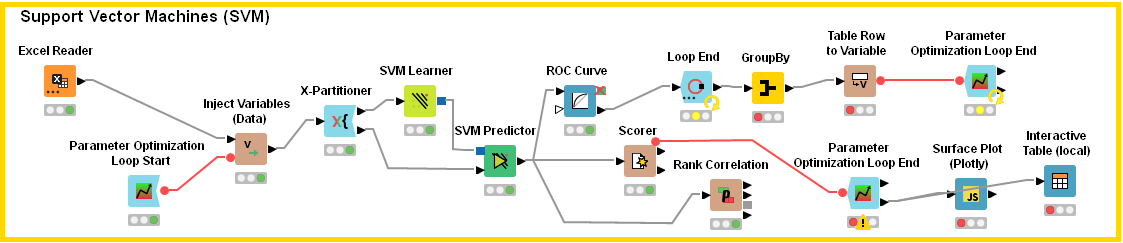
I updated my workflow based on your suggestions (where possible, increasing the step size) – as far-reaching as I could understand the specifics of your changes. I send you (attached) my new version of that workflow.
WF_answers_to_Keerthan 1.knwf (1.9 MB)
Thou, I’m feeling compelled to comment with you a few things I couldn’t reach:
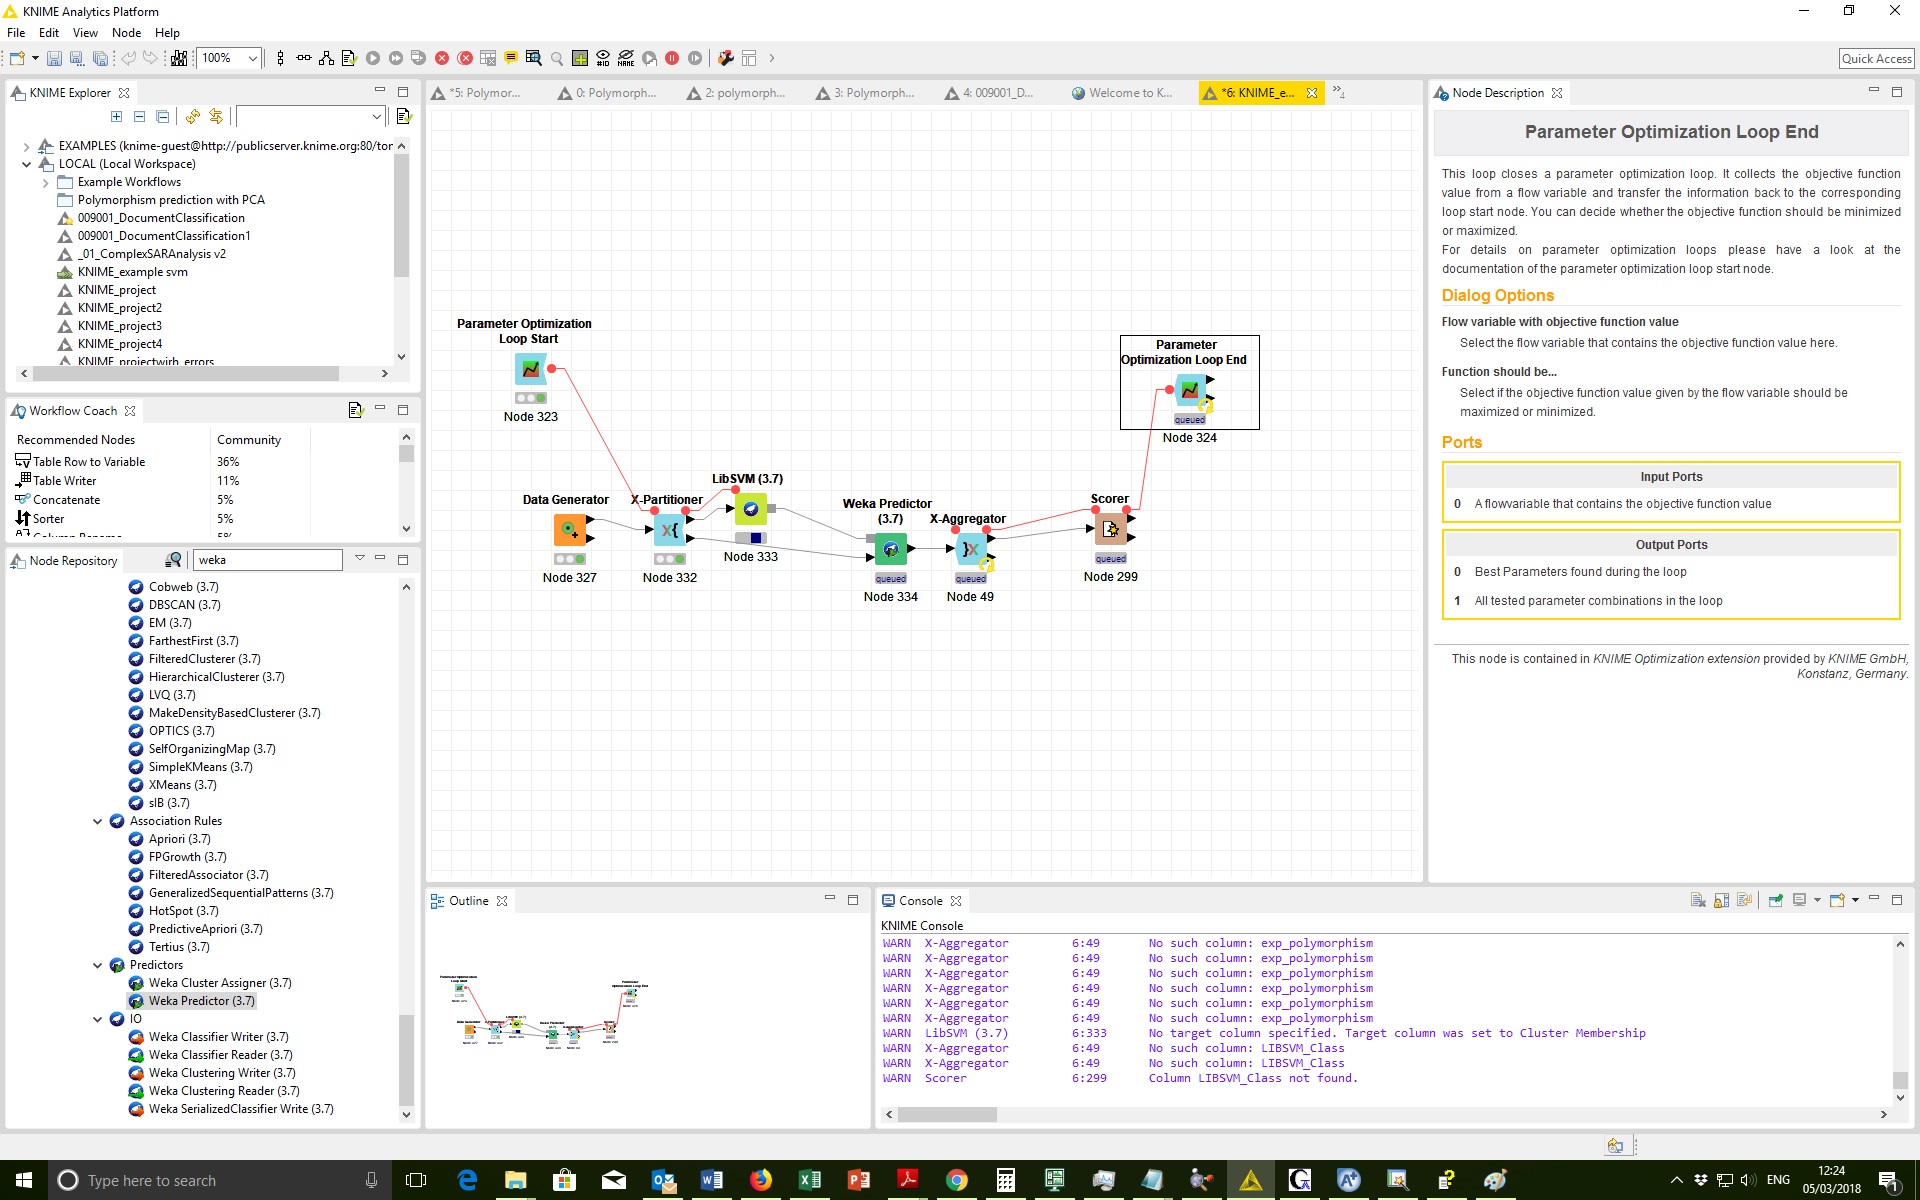
- (on your original answer) the component presents only 10 results on the Parameter Optimization Loop End → All parameters. How can I enlarge this number?
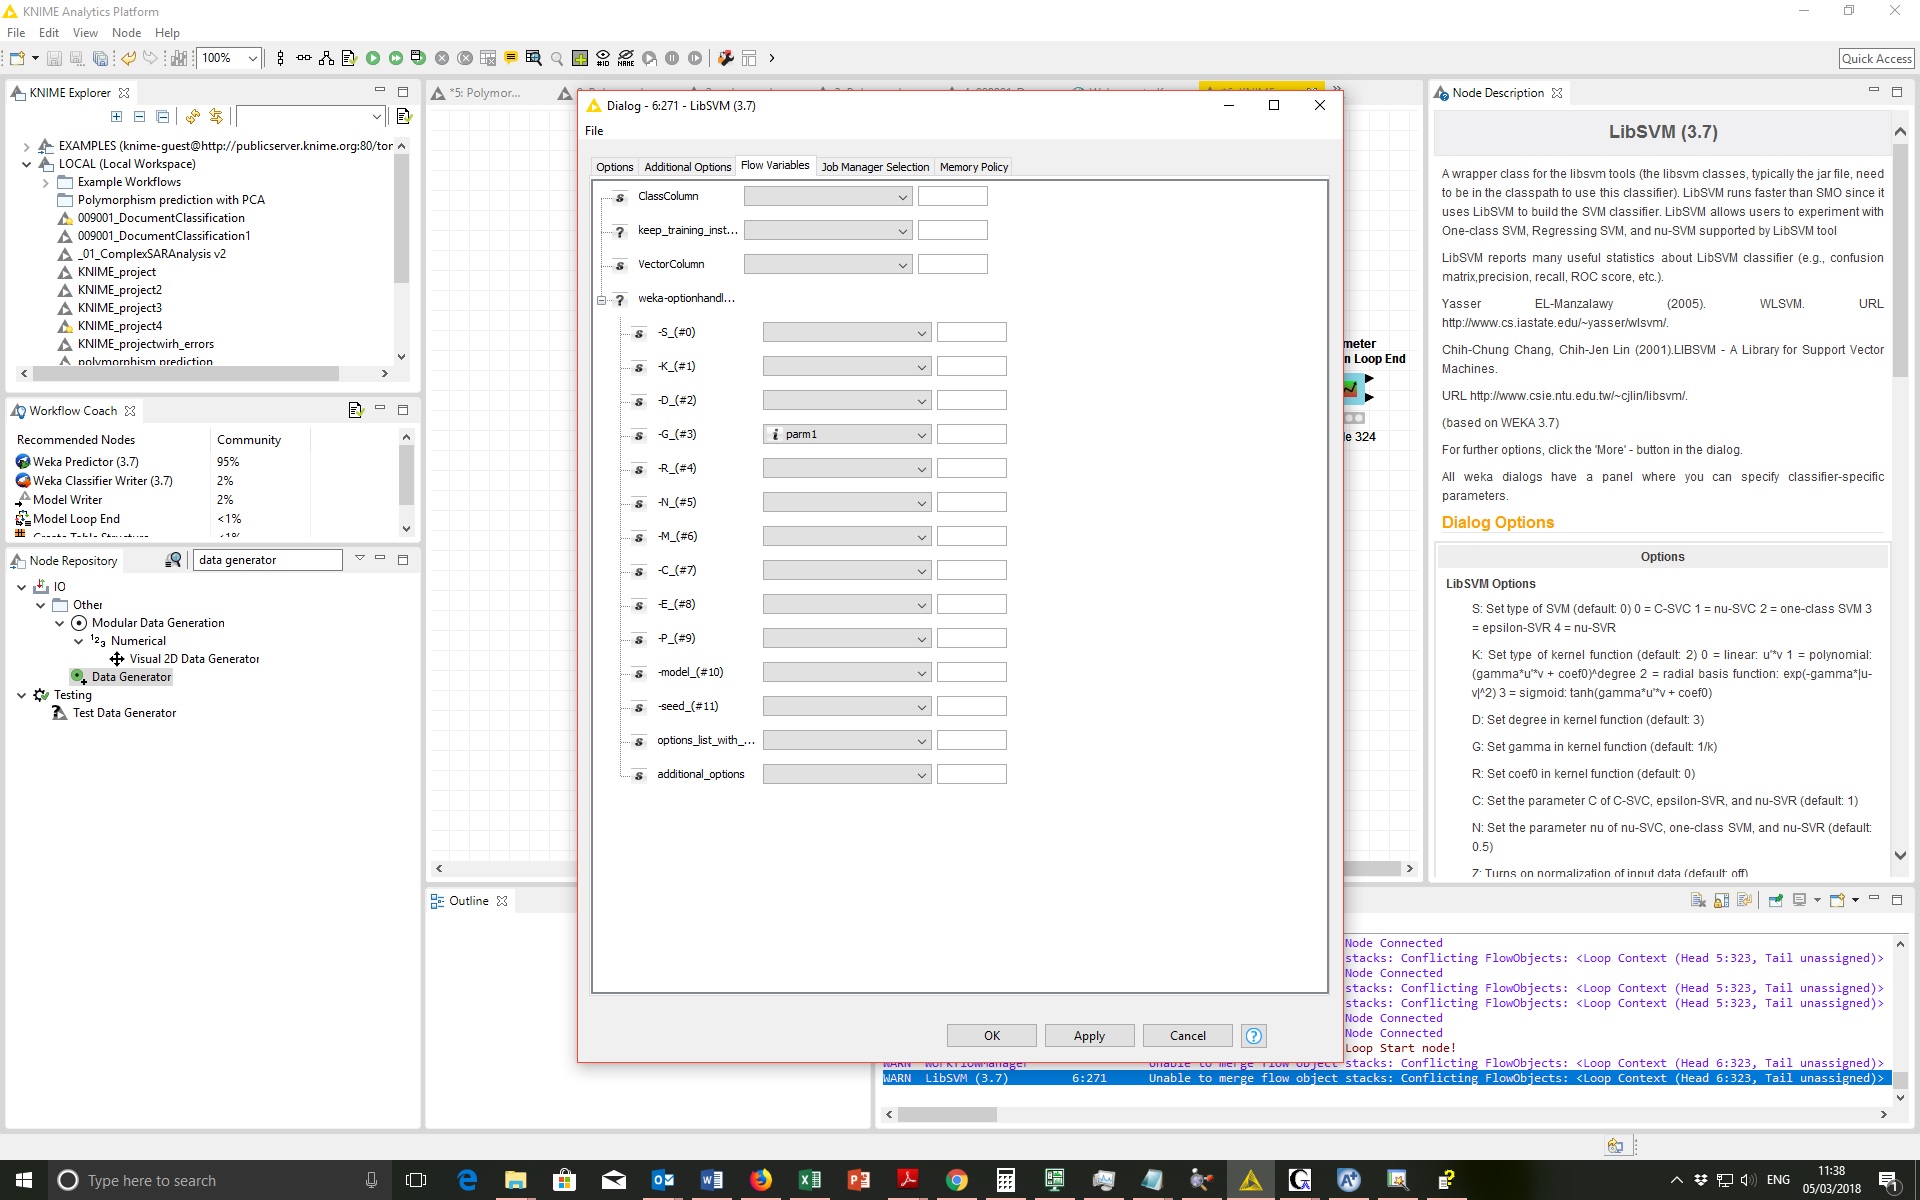
- on SVM, I’ve increased the step size, as you suggested, changing them into:
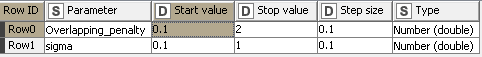
and thus I got a low “best accuracy” (of 0.2835) in the ‘Best parameters’ right-click option of the component:
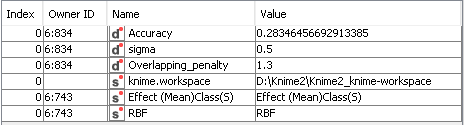
Opening the Component, I also saw that almost all SVM predictions (except by 4 from 55 instances) were in the same class (= “0.1”). So, I guess the real accuracy was “0”, because some original instances belonged to that class, and this coincided with the class to which a few points were assigned to this class just by chance. What could I do now to fix that?
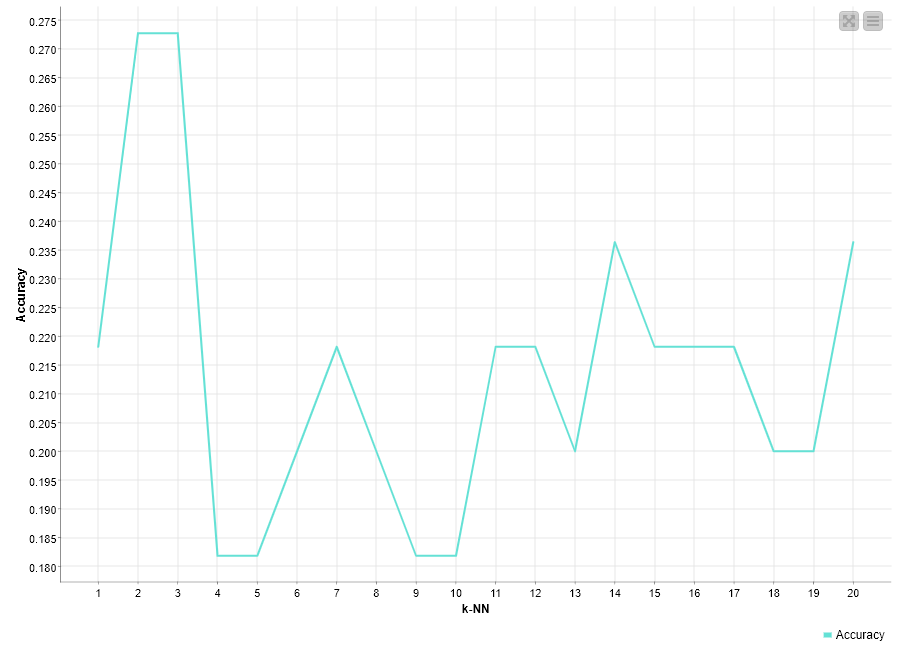
b) on k-NN (testing k values in the interval {2; 20], the accuracy attained was 0.273 (for both 2 and 3 nearest neighbors). After these results, I applied the ‘Line Plot’ node, which rendered this graph:
.
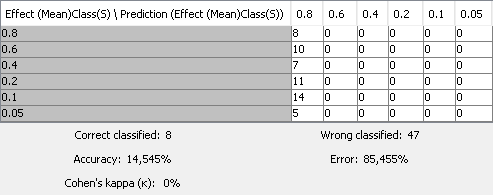
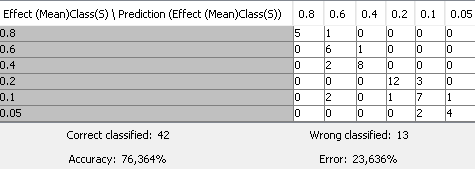
According to the Elbow Method, the k = 2 to 3 (the first “elbow”) would be the best numbers (I chose k = 3). I also tried to test (and compare to) (almost) the same application, but with no loops, and with k = 3, which rendered me the following Confusion Matrix:
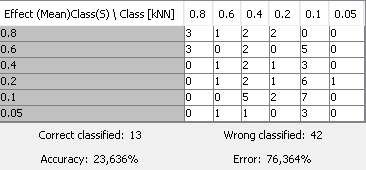
The data classification in this matrix was somewhat strange. Data seem to be fully dispersed along it, which leads to the supposition that the “right classifications” were generated just by chance. Does it look the same to you? In such a case, what could I do to reduce this data dispersion?
c) on Naïve Bayes (NB), (almost) everything was different.
That happened when I was trying to follow your suggestions. Then, I’ve increased the step size, according to the below table:
Thus, my “best results” were remarkably different from the ones I got before:
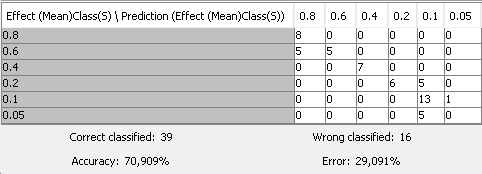
Then, I opened the Component and selected “All parameters” (on the “Parameter Optimization Loop End”, and I saw that the accuracies were equal (= 0.709) for all 10 parameters.Are the Naïve Bayes’ results so different from the former ones?
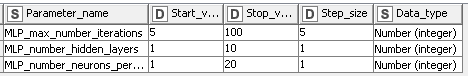
d) on MLP, I applied the following (as you suggested):
And got these results (= 0,7717), which are somewhat similar to NB’s ones, but remarkably different from the remainder algorithms:
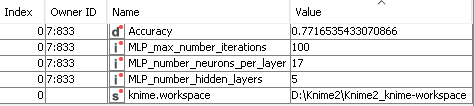
Would you mind helping me to understand such high differences?
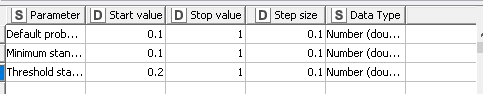
e) on PNN (as in your original answer, using ‘Minimum standard deviation’ as ‘Theta Minus’ and ‘Threshold Standard Deviation’ as ‘Theta Plus’) I also increased the step size, like:

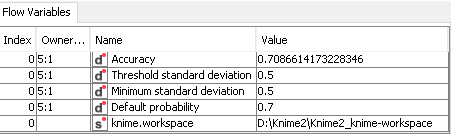
And got these results:
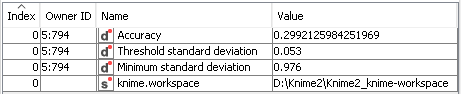
The PNN’s accuracy (= 0.299) is somewhat close to SVM’s and to k-NN’s results, but once again very different from NB’s and MLP’s.
Can you enlighten me about what is happening (or should have happened)?
Thanks again for all your help.
B.R.,
Rogério.