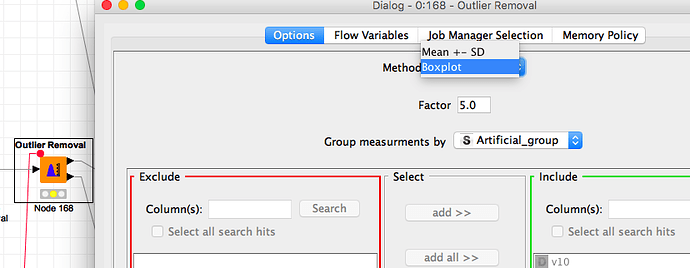
I am using the Outlier Removal node with the BoxPlot method and a 1.5 factor to identify outliers in a data set of 440 records and 6 parameters. However, not all the true outliers are being identified when I compare the results with a manual analysis (I determined the 1.5*IQR values for each parameter in Excel and filtered out all the outlier rows - I get 42 rows that are outliers while the Outlier Removal node only identifies 24). I am new to KNIME and the Forum - any tips would be appreciated.
I do not know about the (new) outlier removal node from KNIME itself. There is a package “KNIME HCS Tools” that also has an outlier removal node that comes with some advanced options.
KNIME HCS Tools 3.1.101.v201604271109 de.mpicbg.tds.knime.hcstools.feature.feature.group Max Planck Institute of Molecular Cell Biology and Genetics (MPI-CBG)
Is there any Outlier Removal node in core KNIME? I only know about the HCS one you are mentioning…
In case you’re using the node mentioned by @mlauber71, please note that it determines the IQR between the 25 and 85 (not 75) percentiles (see the node description). I filed an issue on Github mentioning this:
To work around this and use the true inter-quartile range, you can use an R Snippet node with the following code (without grouping though):
x = knime.in$"value"
result <- x[!x %in% boxplot.stats(x)$out]
knime.out <- data.frame(result)
See also this stackoverflow post:
Not to date. We will release it with 3.6.
If you want to check it out, you could use the nightly.
Cheers, Iris
