Hi there @adepani,
as I told you here I don’t think Parallel Coordinates Plot node can help you. On the other hand Sunburst Chart node might but prior to that seems you have to do some (heavy) preprocessing.
This is example table you need for Sunburst Chart:
| Player | Area | Assist | Number |
|---|---|---|---|
| Al Horford | Within 4 ft | Gordon Hayword | 20 |
| Al Horford | Within 4 ft | Marcus Smart | 5 |
| Al Horford | Short 2 | Terry Rozier | 17 |
| Al Horford | Short 2 | Marcus Smart | 16 |
| Al Horford | Short 2 | Jason Taytum | 20 |
| Al Horford | Long 2 | 4 | |
| Al Horford | Long 2 | Marcus Smart | 8 |
| Al Horford | Corner 3s | Gordon Hayword | 9 |
| Al Horford | Corner 3s | Marcus Smart | 20 |
| Al Horford | Short 3s | Terry Rozier | 25 |
| … |
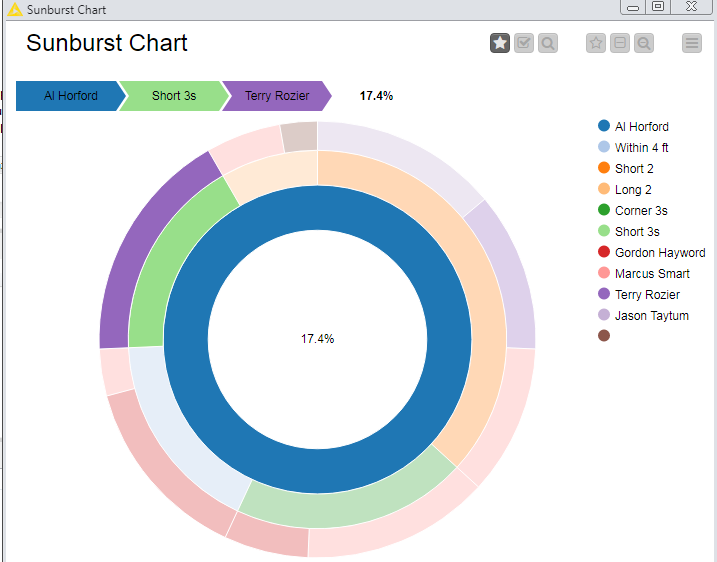
Then you will get something like this:
But as @armingrudd asked here you should upload sample data (for example first 10 rows) if you want help manipulating your data to get format you need…
Do you need help with uploading sample data?
Br,
Ivan