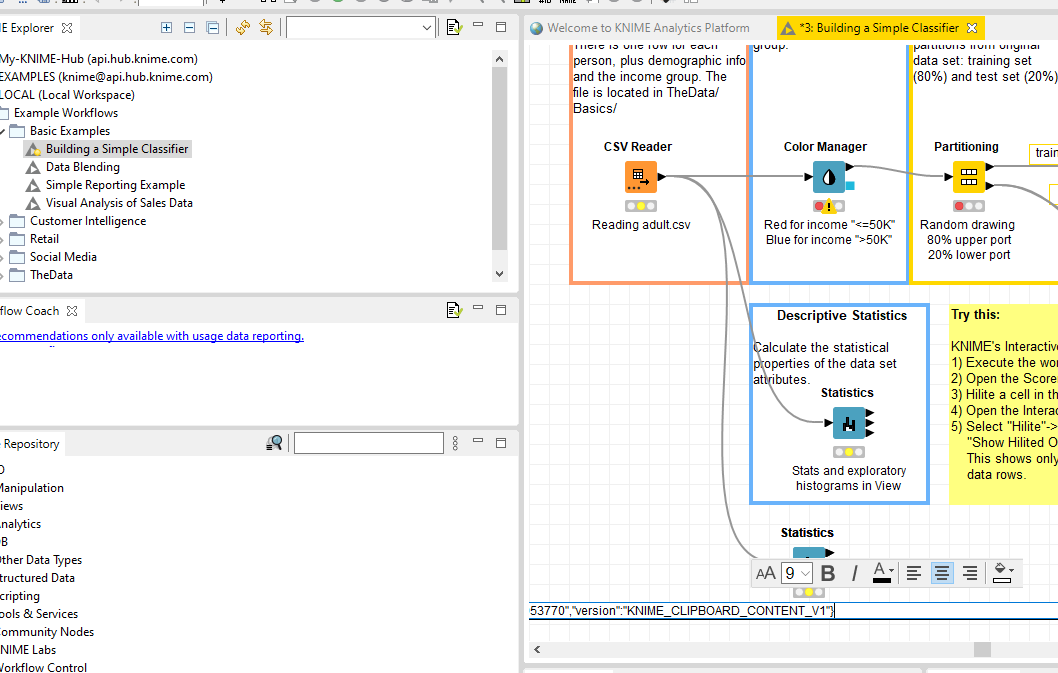
I pasted the Statistics node into a description field of its own copy. Here’s the very long (thus cropped), JSON-like string result I get:
{“payload”:{“annotations”:{“11”:{“bgcolor”:16777215,“borderColor”:16766976,“borderSize”:1,“defaultFontSize”:9,“height”:21,“location”:{“x”:520,“y”:400},“styles”:,“text”:" test set",“textAlignment”:“LEFT”,“width”:61},“12”:{“bgcolor”:16777088,“borderColor”:16777088,“borderSize”:2,“defaultFontSize”:9,“height”:201,“location”:{“x”:420,“y”:520},“styles”:[{“color”:0,“fontName”:“Arial”,“fontSize”:10,“fontStyle”:1,“length”:11,“start”:0},{“color”:0,“fontName”:“Arial”,“fontSize”:10,“fontStyle”:0,“length”:283,“start”:11}],“text”:“Try this:\r\n\r\nKNIME’s Interactive Visualizations: \r\n1) Execute the workflow\r\n2) Open the Scorer node view\r\n3) Hilite a cell in the confusion matrix\r\n4) Open the Interactive Table view\r\n5) Select "Hilite" → "Filter" → \r\n "Show Hilited Only"\r\n This shows only the misclassified\r\n data rows.”,“textAlignment”:“LEFT”,“width”:241},“0”:{“bgcolor”:16777215,“borderColor”:16766976,“borderSize”:4,“defaultFontSize”:9,“height”:141,“location”:{“x”:40,“y”:40},“styles”:[{“color”:0,“fontName”:“Arial”,“fontSize”:10,“fontStyle”:1,“length”:44,“start”:0},{“color”:0,“fontName”:“Arial”,“fontSize”:10,“fontStyle”:0,“length”:218,“start”:44},{“color”:0,“fontName”:“Arial”,“fontSize”:10,“fontStyle”:1,“length”:2,“start”:262},{“color”:0,“fontName”:“Arial”,“fontSize”:10,“fontStyle”:0,“length”:2,“start”:264},{“color”:0,“fontName”:“Arial”,“fontSize”:10,“fontStyle”:1,“length”:4,“start”:266},{“color”:0,“fontName”:“Arial”,“fontSize”:10,“fontStyle”:0,“length”:127,“start”:270},{“color”:0,“fontName”:“Arial”,“fontSize”:10,“fontStyle”:1,“length”:12,“start”:397},{“color”:0,“fontName”:“Arial”,“fontSize”:10,“fontStyle”:0,“length”:92,“start”:409}],“text”:“Simple Model Training for Classification\r\n\r\nThis workflow demonstrates how a simple classifier is built and applied to new data. It also illustrates the use of KNIME’s hiliting capabilities, which allow interactive views to be connected within the same workflow.\r\n\r\nTask Predict the income group from demographic attributes of the adult data set (census data).\r\n\r\nFind more information on KNIME’s Learning Hub at KNIME Learning Center | KNIME (tutorials, videos, white papers, many more workflows)”,“textAlignment”:“LEFT”,“width”:1021},“1”:{“bgcolor”:16777215,“borderColor”:16751466,“borderSize”:4,“defaultFontSize”:9,“height”:301,“location”:{“x”:40,“y”:200},“styles”:[{“color”:0,“fontName”:“Arial”,“fontSize”:10,“fontStyle”:1,“length”:24,“start”:0},{“color”:0,“fontName”:“Arial”,“fontSize”:10,“fontStyle”:0,“length”:148,“start”:24}],“text”:" Data Reading\r\n\r\nRead the adult data set file. There is one row for each person, plus demographic info and the income group. The file is located in TheData/Basics/“,“textAlignment”:“LEFT”,“width”:181},“2”:{“bgcolor”:16777215,“borderColor”:6992891,“borderSize”:4,“defaultFontSize”:9,“height”:301,“location”:{“x”:220,“y”:200},“styles”:[{“color”:0,“fontName”:“Arial”,“fontSize”:10,“fontStyle”:1,“length”:24,“start”:0},{“color”:0,“fontName”:“Arial”,“fontSize”:10,“fontStyle”:0,“length”:32,“start”:24}],“text”:” Graphical Properties\r\n\r\nAssign colors by income group.“,“textAlignment”:“LEFT”,“width”:161},“3”:{“bgcolor”:16777215,“borderColor”:16766976,“borderSize”:4,“defaultFontSize”:9,“height”:301,“location”:{“x”:380,“y”:200},“styles”:[{“color”:0,“fontName”:“Arial”,“fontSize”:10,“fontStyle”:1,“length”:24,“start”:0},{“color”:0,“fontName”:“Arial”,“fontSize”:10,“fontStyle”:0,“length”:95,“start”:24}],“text”:” Data Partitioning\r\n\r\nCreate two separate partitions from original data set: training set (80%) and test set (20%).“,“textAlignment”:“LEFT”,“width”:161},“4”:{“bgcolor”:16777215,“borderColor”:14020978,“borderSize”:4,“defaultFontSize”:9,“height”:301,“location”:{“x”:540,“y”:200},“styles”:[{“color”:0,“fontName”:“Arial”,“fontSize”:10,“fontStyle”:1,“length”:31,“start”:0},{“color”:0,“fontName”:“Arial”,“fontSize”:10,“fontStyle”:0,“length”:141,“start”:31}],“text”:” Train a Model\r\n\r\nThis node builds a decision tree. Other Learner nodes train other models. Most Learner nodes output a PMML model (blue square output port).“,“textAlignment”:“LEFT”,“width”:241},“5”:{“bgcolor”:16777215,“borderColor”:300888,“borderSize”:4,“defaultFontSize”:9,“height”:301,“location”:{“x”:780,“y”:200},“styles”:[{“color”:0,“fontName”:“Arial”,“fontSize”:10,“fontStyle”:1,“length”:20,“start”:0},{“color”:0,“fontName”:“Arial”,“fontSize”:10,“fontStyle”:0,“length”:89,“start”:20}],“text”:” Apply the Model\r\n\r\nPredictor nodes apply a specific model to a data set and append the model predictions. “,“textAlignment”:“LEFT”,“width”:141},“6”:{“bgcolor”:16777215,“borderColor”:14649867,“borderSize”:4,“defaultFontSize”:9,“height”:301,“location”:{“x”:920,“y”:200},“styles”:[{“color”:0,“fontName”:“Arial”,“fontSize”:10,“fontStyle”:1,“length”:19,“start”:0},{“color”:0,“fontName”:“Arial”,“fontSize”:10,“fontStyle”:0,“length”:113,“start”:19}],“text”:” Score the Model\r\n\r\nCompute a confusion matrix between real and predicted class values and calculate the related accuracy measures.“,“textAlignment”:“LEFT”,“width”:141},“7”:{“bgcolor”:16777215,“borderColor”:6992891,“borderSize”:4,“defaultFontSize”:9,“height”:200,“location”:{“x”:880,“y”:520},“styles”:[{“color”:0,“fontName”:“Arial”,“fontSize”:10,“fontStyle”:1,“length”:25,“start”:0},{“color”:0,“fontName”:“Arial”,“fontSize”:10,“fontStyle”:0,“length”:34,“start”:25}],“text”:” Visualize \r\n\r\nCreate interactive scatter plot.“,“textAlignment”:“LEFT”,“width”:181},“8”:{“bgcolor”:16777215,“borderColor”:6992891,“borderSize”:4,“defaultFontSize”:9,“height”:202,“location”:{“x”:220,“y”:519},“styles”:[{“color”:0,“fontName”:“Arial”,“fontSize”:10,“fontStyle”:1,“length”:31,“start”:0},{“color”:0,“fontName”:“Arial”,“fontSize”:10,“fontStyle”:0,“length”:66,“start”:31}],“text”:” Descriptive Statistics \r\n\r\nCalculate the statistical properties of the data set attributes.“,“textAlignment”:“LEFT”,“width”:181},“9”:{“bgcolor”:16777215,“borderColor”:6992891,“borderSize”:4,“defaultFontSize”:9,“height”:201,“location”:{“x”:680,“y”:520},“styles”:[{“color”:0,“fontName”:“Arial”,“fontSize”:10,“fontStyle”:1,“length”:29,“start”:0},{“color”:0,“fontName”:“Arial”,“fontSize”:10,“fontStyle”:0,“length”:36,“start”:29}],“text”:” Interactive Table\r\n\r\nDisplay table of the entire data\r\n",“textAlignment”:“LEFT”,“width”:201},“10”:{“bgcolor”:16777215,“borderColor”:16766976,“borderSize”:1,“defaultFontSize”:9,“height”:21,“location”:{“x”:500,“y”:360},“styles”:,“text”:" training set",“textAlignment”:“LEFT”,“width”:81}},“connections”:[{“deletable”:true,“destID”:9,“destPort”:1,“sourceID”:14,“sourcePort”:1,“uiSettings”:{“bendPoints”:}},{“deletable”:true,“destID”:5,“destPort”:1,“sourceID”:2,“sourcePort”:1,“uiSettings”:{“bendPoints”:}},{“deletable”:true,“destID”:2,“destPort”:1,“sourceID”:14,“sourcePort”:1,“uiSettings”:{“bendPoints”:}},{“deletable”:true,“destID”:12,“destPort”:1,“sourceID”:4,“sourcePort”:1,“uiSettings”:{“bendPoints”:}},{“deletable”:true,“destID”:11,“destPort”:1,“sourceID”:4,“sourcePort”:1,“uiSettings”:{“bendPoints”:[{“x”:909,“y”:640}]}},{“deletable”:true,“destID”:4,“destPort”:2,“sourceID”:5,“sourcePort”:2,“uiSettings”:{“bendPoints”:[{“x”:629,“y”:478}]}},{“deletable”:true,“destID”:10,“destPort”:1,“sourceID”:5,“sourcePort”:1,“uiSettings”:{“bendPoints”:}},{“deletable”:true,“destID”:4,“destPort”:1,“sourceID”:10,“sourcePort”:1,“uiSettings”:{“bendPoints”:}},{“deletable”:true,“destID”:7,“destPort”:1,“sourceID”:5,“sourcePort”:2,“uiSettings”:{“bendPoints”:[{“x”:735,“y”:658}]}},{“deletable”:true,“destID”:15,“destPort”:1,“sourceID”:14,“sourcePort”:1,“uiSettings”:{“bendPoints”:}}],“nodes”:{“11”:{“annotation”:{“annotationDefault”:false,“data”:{“bgcolor”:16777215,“borderColor”:16777215,“borderSize”:0,“defaultFontSize”:9,“height”:30,“location”:{“x”:918,“y”:681},“styles”:,“text”:“Age vs. number-hours\r\ncolor-coded by income”,“textAlignment”:“CENTER”,“width”:124}},“bundle”:{“name”:“KNIME JavaScript Base Views”,“symbolicName”:“org.knime.js.views”,“vendor”:“KNIME AG, Zurich, Switzerland”,“version”:“4.6.0.v202202280849”},“factory”:“org.knime.js.base.node.viz.plotter.scatterSelectionAppender.ScatterPlotNodeFactory”,“factorySettings”:{“children”:{},“configType”:“ConfigMap”,“key”:“factory_settings”},“feature”:{“name”:“KNIME JavaScript Views”,“symbolicName”:“org.knime.features.js.views.feature.group”,“vendor”:“KNIME AG, Zurich, Switzerland”,“version”:“4.6.0.v202204171836”},“id”:11,“internalNodeSubSettings”:{“children”:{“internal_node_subsettings”:{“children”:{“memory_policy”:{“configType”:“ConfigValueString”,“value”:“CacheSmallInMemory”}},“configType”:“ConfigMap”,“key”:“internal_node_subsettings”},“model”:{“children”:{“displayFullscreenButton”:{“configType”:“ConfigValueBoolean”,“value”:true},“enableZooming”:{“configType”:“ConfigValueBoolean”,“value”:true},“dateTimeFormats_Internals”:{“children”:{“SettingsModelID”:{“configType”:“ConfigValueString”,“value”:“SMID_datetime”},“EnabledStatus”:{“configType”:“ConfigValueBoolean”,“value”:true}},“configType”:“ConfigMap”,“key”:“dateTimeFormats_Internals”},“showLegend”:{“configType”:“ConfigValueBoolean”,“value”:false},“autoRange”:{“configType”:“ConfigValueBoolean”,“value”:true},“enforceOrigin”:{“configType”:“ConfigValueBoolean”,“value”:false},“maxRows”:{“configType”:“ConfigValueInt”,“value”:12500},“hideInWizard”:{“configType”:“ConfigValueBoolean”,“value”:false},“enableDotSizeChange”:{“configType”:“ConfigValueBoolean”,“value”:false},“enableLassoSelection”:{“configType”:“ConfigValueBoolean”,“value”:false},“dataAreaColor”:{“configType”:“ConfigValueString”,“value”:“rgba(230,230,230,1.0)”},“dot_size”:{“configType”:“ConfigValueString”,“value”:“3”},“xAxisMin”:{“configType”:“ConfigValueString”},“yAxisMin”:{“configType”:“ConfigValueString”},“imageWidth”:{“configType”:“ConfigValueInt”,“value”:800},“enableSwitchLegend”:{“configType”:“ConfigValueBoolean”,“value”:true},“chartSubtitle”:{“configType”:“ConfigValueString”,“value”:“”},“resizeToWindow”:{“configType”:“ConfigValueBoolean”,“value”:true},“showGrid”:{“configType”:“ConfigValueBoolean”,“value”:true},“selectionColumnName”:{“configType”:“ConfigValueString”,“value”:“Selected (Scatter Plot)”},“xAxisMax”:{“configType”:“ConfigValueString”},“useDomainInformation”:{“configType”:“ConfigValueBoolean”,“value”:false},“showCrosshair”:{“configType”:“ConfigValueBoolean”,“value”:false},“showZoomResetButton”:{“configType”:“ConfigValueBoolean”,“value”:false},“enableViewConfiguration”:{“configType”:“ConfigValueBoolean”,“value”:true},“enableXColumnChange”:{“configType”:“ConfigValueBoolean”,“value”:true},“enableYColumnChange”:{“configType”:“ConfigValueBoolean”,“value”:true},“chartTitle”:{“configType”:“ConfigValueString”,“value”:“”},“xAxisLabel”:{“configType”:“ConfigValueString”,“value”:“”},“subscribeSelection”:{“configType”:“ConfigValueBoolean”,“value”:true},“generateImage”:{“configType”:“ConfigValueBoolean”,“value”:false},“enableSubtitleChange”:{“configType”:“ConfigValueBoolean”,“value”:true},“publishSelection”:{“configType”:“ConfigValueBoolean”,“value”:true},“xCol”:{“configType”:“ConfigValueString”,“value”:“age”},“backgroundColor”:{“configType”:“ConfigValueString”,“value”:“rgba(255,255,255,1.0)”},“enableDragZooming”:{“configType”:“ConfigValueBoolean”,“value”:true},“enableRectangleSelection”:{“configType”:“ConfigValueBoolean”,“value”:true},“enableShowSelectedOnly”:{“configType”:“ConfigValueBoolean”,“value”:true},“enableSelection”:{“configType”:“ConfigValueBoolean”,“value”:true},“imageHeight”:{“configType”:“ConfigValueInt”,“value”:600},“dateTimeFormats”:{“children”:{“timezone_Internals”:{“children”:{“SettingsModelID”:{“configType”:“ConfigValueString”,“value”:“SMID_string”},“EnabledStatus”:{“configType”:“ConfigValueBoolean”,“value”:true}},“configType”:“ConfigMap”,“key”:“timezone_Internals”},“globalLocalDateFormat”:{“configType”:“ConfigValueString”,“value”:“YYYY-MM-DD”},“globalDateTimeLocale_Internals”:{“children”:{“SettingsModelID”:{“configType”:“ConfigValueString”,“value”:“SMID_string”},“EnabledStatus”:{“configType”:“ConfigValueBoolean”,“value”:true}},“configType”:“ConfigMap”,“key”:“globalDateTimeLocale_Internals”},“timezone”:{“configType”:“ConfigValueString”,“value”:“Europe/Berlin”},“globalLocalTimeFormat_Internals”:{“children”:{“SettingsModelID”:{“configType”:“ConfigValueString”,“value”:“SMID_string”},“EnabledStatus”:{“configType”:“ConfigValueBoolean”,“value”:true}},“configType”:“ConfigMap”,“key”:“globalLocalTimeFormat_Internals”},“globalLocalDateFormat_Internals”:{“children”:{“SettingsModelID”:{“configType”:“ConfigValueString”,“value”:“SMID_string”},“EnabledStatus”:{“configType”:“ConfigValueBoolean”,“value”:true}},“configType”:“ConfigMap”,“key”:“globalLocalDateFormat_Internals”},“globalLocalDateTimeFormat”:{“configType”:“ConfigValueString”,“value”:“YYYY-MM-DD”},“globalLocalTimeFormat”:{“configType”:“ConfigValueString”,“value”:“HH:mm:ss”},“globalDateFormat_Internals”:{“children”:{“SettingsModelID”:{“configType”:“ConfigValueString”,“value”:“SMID_string”},“EnabledStatus”:{“configType”:“ConfigValueBoolean”,“value”:true}},“configType”:“ConfigMap”,“key”:“globalDateFormat_Internals”},“globalZonedDateTimeFormat_Internals”:{“children”:{“SettingsModelID”:{“configType”:“ConfigValueString”,“value”:“SMID_string”},“EnabledStatus”:{“configType”:“ConfigValueBoolean”,“value”:true}},“configType”:“ConfigMap”,“key”:“globalZonedDateTimeFormat_Internals”},“globalDateTimeLocale”:{“configType”:“ConfigValueString”,“value”:“en”},“globalDateFormat”:{“configType”:“ConfigValueString”,“value”:“YYYY-MM-DD”},“globalLocalDateTimeFormat_Internals”:{“children”:{“SettingsModelID”:{“configType”:“ConfigValueString”,“value”:“SMID_string”},“EnabledStatus”:{“configType”:“ConfigValueBoolean”,“value”:true}},“configType”:“ConfigMap”,“key”:“globalLocalDateTimeFormat_Internals”},“globalZonedDateTimeFormat”:{“configType”:“ConfigValueString”,“value”:“YYYY-MM-DD z”}},“configType”:“ConfigMap”,“key”:“dateTimeFormats”},“yAxisMax”:{“configType”:“ConfigValueString”},“showWarningInView”:{“configType”:“ConfigValueBoolean”,“value”:true},“yAxisLabel”:{“configType”:“ConfigValueString”,“value”:“”},“subscribeFilter”:{“configType”:“ConfigValueBoolean”,“value”:true},“enableTitleChange”:{“configType”:“ConfigValueBoolean”,“value”:true},“enableXAxisLabelEdit”:{“configType”:“ConfigValueBoolean”,“value”:true},“reportOnMissingValues”:{“configType”:“ConfigValueBoolean”,“value”:true},“enablePanning”:{“configType”:“ConfigValueBoolean”,“value”:true},“snapToPoints”:{“configType”:“ConfigValueBoolean”,“value”:false},“showSelectedOnly”:{“configType”:“ConfigValueBoolean”,“value”:false},“gridColor”:{“configType”:“ConfigValueString”,“value”:“rgba(255,255,255,1.0)”},“enableYAxisLabelEdit”:{“configType”:“ConfigValueBoolean”,“value”:true},“yCol”:{“configType”:“ConfigValueString”,“value”:“hours-per-week”}},“configType”:“ConfigMap”,“key”:“model”}},“configType”:“ConfigMap”,“key”:“internal_node_subsettings”},“locks”:{“hasConfigureLock”:false,“hasDeleteLock”:false,“hasResetLock”:false},“modelSettings”:{“children”:{“displayFullscreenButton”:{“configType”:“ConfigValueBoolean”,“value”:true},“enableZooming”:{“configType”:“ConfigValueBoolean”,“value”:true},“dateTimeFormats_Internals”:{“children”:{“SettingsModelID”:{“configType”:“ConfigValueString”,“value”:“SMID_datetime”},“EnabledStatus”:{“configType”:“ConfigValueBoolean”,“value”:true}},“configType”:“ConfigMap”,“key”:“dateTimeFormats_Internals”},“showLegend”:{“configType”:“ConfigValueBoolean”,“value”:false},“autoRange”:{“configType”:“ConfigValueBoolean”,“value”:true},“enforceOrigin”:{“configType”:“ConfigValueBoolean”,“value”:false},“maxRows”:{“configType”:“ConfigValueInt”,“value”:12500},“hideInWizard”:{“configType”:“ConfigValueBoolean”,“value”:false},“enableDotSizeChange”:{“configType”:“ConfigValueBoolean”,“value”:false},“enableLassoSelection”:{“configType”:“ConfigValueBoolean”,“value”:false},“dataAreaColor”:{“configType”:“ConfigValueString”,“value”:“rgba(230,230,230,1.0)”},“dot_size”:{“configType”:“ConfigValueString”,“value”:“3”},“xAxisMin”:{“configType”:“ConfigValueString”},“yAxisMin”:{“configType”:“ConfigValueString”},“imageWidth”:{“configType”:“ConfigValueInt”,“value”:800},“enableSwitchLegend”:{“configType”:“ConfigValueBoolean”,“value”:true},“chartSubtitle”:{“configType”:“ConfigValueString”,“value”:“”},“resizeToWindow”:{“configType”:“ConfigValueBoolean”,“value”:true},“showGrid”:{“configType”:“ConfigValueBoolean”,“value”:true},“selectionColumnName”:{“configType”:“ConfigValueString”,“value”:“Selected (Scatter Plot)”},“xAxisMax”:{“configType”:“ConfigValueString”},“useDomainInformation”:{“configType”:“ConfigValueBoolean”,“value”:false},“showCrosshair”:{“configType”:“ConfigValueBoolean”,“value”:false},“showZoomResetButton”:{“configType”:“ConfigValueBoolean”,“value”:false},“enableViewConfiguration”:{“configType”:“ConfigValueBoolean”,“value”:true},“enableXColumnChange”:{“configType”:“ConfigValueBoolean”,“value”:true},“enableYColumnChange”:{“configType”:“ConfigValueBoolean”,“value”:true},“chartTitle”:{“configType”:“ConfigValueString”,“value”:“”},“xAxisLabel”:{“configType”:“ConfigValueString”,“value”:“”},“subscribeSelection”:{“configType”:“ConfigValueBoolean”,“value”:true},“generateImage”:{“configType”:“ConfigValueBoolean”,“value”:false},“enableSubtitleChange”:{“configType”:“ConfigValueBoolean”,“value”:true},“publishSelection”:{“configType”:“ConfigValueBoolean”,“value”:true},“xCol”:{“configType”:“ConfigValueString”,“value”:“age”},“backgroundColor”:{“configType”:“ConfigValueString”,“value”:“rgba(255,255,255,1.0)”},“enableDragZooming”:{“configType”:“ConfigValueBoolean”,“value”:true},“enableRectangleSelection”:{“configType”:“ConfigValueBoolean”,“value”:true},“enableShowSelectedOnly”:{“configType”:“ConfigValueBoolean”,“value”:true},“enableSelection”:{“configType”:“ConfigValueBoolean”,“value”:true},“imageHeight”:{“configType”:“ConfigValueInt”,“value”:600},“dateTimeFormats”:{“children”:{“timezone_Internals”:{“children”:{“SettingsModelID”:{“configType”:“ConfigValueString”,“value”:“SMID_string”},“EnabledStatus”:{“configType”:“ConfigValueBoolean”,“value”:true}},“configType”:“ConfigMap”,“key”:“timezone_Internals”},“globalLocalDateFormat”:{“configType”:“ConfigValueString”,“value”:“YYYY-MM-DD”},“globalDateTimeLocale_Internals”:{“children”:{“SettingsModelID”:{“configType”:“ConfigValueString”,“value”:“SMID_string”},“EnabledStatus”:{“configType”:“ConfigValueBoolean”,“value”:true}},“configType”:“ConfigMap”,“key”:“globalDateTimeLocale_Internals”},“timezone”:{“configType”:“ConfigValueString”,“value”:“Europe/Berlin”},“globalLocalTimeFormat_Internals”:{“children”:{“SettingsModelID”:{“configType”:“ConfigValueString”,“value”:“SMID_string”},“EnabledStatus”:{“configType”:“ConfigValueBoolean”,“value”:true}},“configType”:“ConfigMap”,“key”:“globalLocalTimeFormat_Internals”},“globalLocalDateFormat_Internals”:{“children”:{“SettingsModelID”:{“configType”:“ConfigValueString”,“value”:“SMID_string”},“EnabledStatus”:{“configType”:“ConfigValueBoolean”,“value”:true}},“configType”:“ConfigMap”,“key”:“globalLocalDateFormat_Internals”},“globalLocalDateTimeFormat”:{“configType”:“ConfigValueString”,“value”:“YYYY-MM-DD”},“globalLocalTimeFormat”:{“configType”:“ConfigValueString”,“value”:“HH:mm:ss”},“globalDateFormat_Internals”:{“children”:{“SettingsModelID”:{“configType”:“ConfigValueString”,“value”:“SMID_string”},“EnabledStatus”:{“configType”:“ConfigValueBoolean”,“value”:true}},“configType”:“ConfigMap”,“key”:“globalDateFormat_Internals”},“globalZonedDateTimeFormat_Internals”:{“children”:{“SettingsModelID”:{“configType”:“ConfigValueString”,“value”:“SMID_string”},“EnabledStatus”:{“configType”:“ConfigValueBoolean”,“value”:true}},“configType”:“ConfigMap”,“key”:“globalZonedDateTimeFormat_Internals”},“globalDateTimeLocale”:{“configType”:“ConfigValueString”,“value”:“en”},“globalDateFormat”:{“configType”:“ConfigValueString”,“value”:“YYYY-MM-DD”},“globalLocalDateTimeFormat_Internals”:{“children”:{“SettingsModelID”:{“configType”:“ConfigValueString”,“value”:“SMID_string”},“EnabledStatus”:{“configType”:“ConfigValueBoolean”,“value”:true}},“configType”:“ConfigMap”,“key”:“globalLocalDateTimeFormat_Internals”},“globalZonedDateTimeFormat”:{“configType”:“ConfigValueString”,“value”:“YYYY-MM-DD z”}},“configType”:“ConfigMap”,“key”:“dateTimeFormats”},“yAxisMax”:{“configType”:“ConfigValueString”},“showWarningInView”:{“configType”:“ConfigValueBoolean”,“value”:true},“yAxisLabel”:{“configType”:“ConfigValueString”,“value”:“”},“subscribeFilter”:{“configType”:“ConfigValueBoolean”,“value”:true},“enableTitleChange”:{“configType”:“ConfigValueBoolean”,“value”:true},“enableXAxisLabelEdit”:{“configType”:“ConfigValueBoolean”,“value”:true},“reportOnMissingValues”:{“configType”:“ConfigValueBoolean”,“value”:true},“enablePanning”:{“configType”:“ConfigValueBoolean”,“value”:true},“snapToPoints”:{“configType”:“ConfigValueBoolean”,“value”:false},“showSelectedOnly”:{“configType”:“ConfigValueBoolean”,“value”:false},“gridColor”: cropped for “brevity”
Can you reproduce this? And irrespective of the format (JSON or not), earlier versions of KNIME didn’t do thi – they simply wouldn’t ever paste nodes into text boxes.