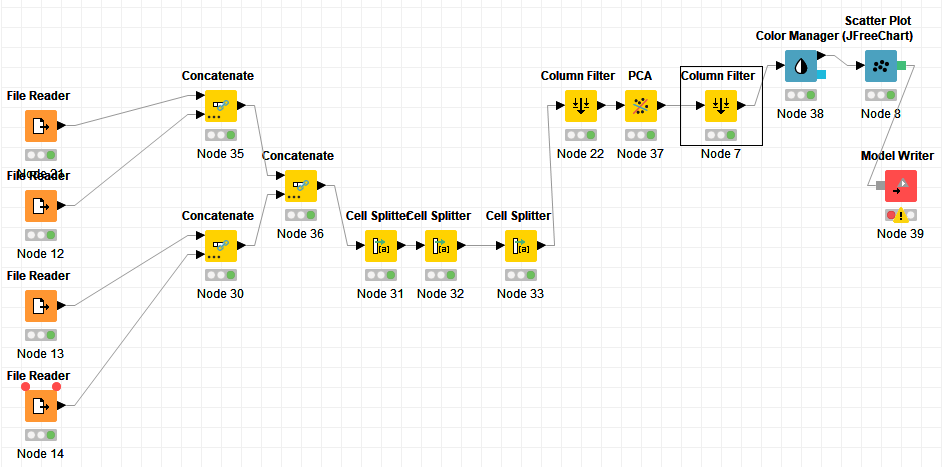
I created one of my first PCA workflow´s and I’m satisfied with the results. Now I’m looking for a Node which gives me the offer to compare the input data (File Reader) and the results of the PCA.
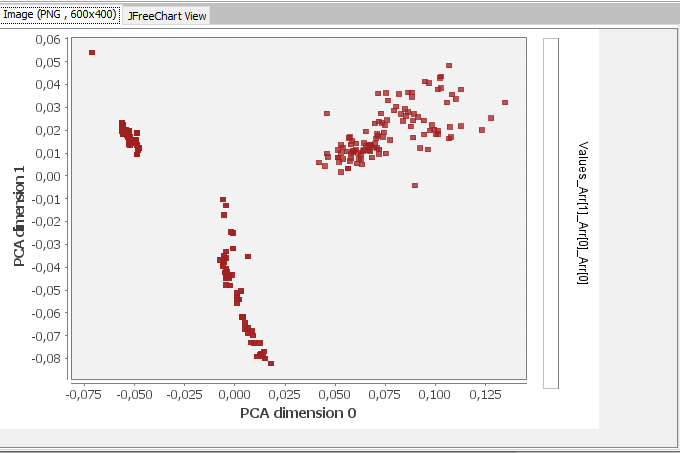
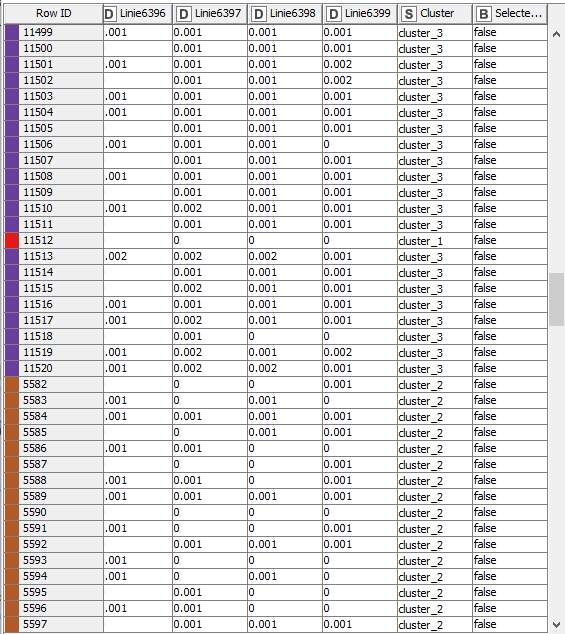
I would like to analyse in which different clusters the rows get. I can see the different clusters in the Scatter Plot but I can’t see any information about correlation.
Now that you have visualized the clusters, you can use a clustering algorithm like K-means to compute the cluster centroids and assign the points to the cluster. The PCA node computes the principal components of the data, but it does not do clustering per se.