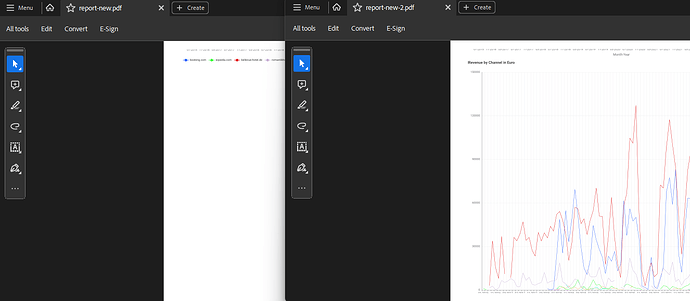
PDF Report ignoring style size declarations

Hi,

due to ongoing struggles to properly set dimensions of charts for reports, I happen to notice that, regardless of the applied settings working for the interactive view, the size values are ignored when creating a PDF report.

{
  "parentLayoutLegacyMode" : false,
  "rows" : [ {
    "type" : "row",
    "additionalStyles" : [ "border-bottom: thin solid grey; max-height: 200mm; max-width: 400mm; margin: 2vh auto 3vh" ],
    "columns" : [ {
      "content" : [ {
        "type" : "view",
        "nodeID" : "1368",
        "resizeMethod" : "aspectRatio4by3",
        "autoResize" : false,
        "useLegacyMode" : false,
        "scrolling" : false,
        "resizeTolerance" : 5,
        "sizeHeight" : true,
        "sizeWidth" : false
      } ],
      "widthXS" : 12
    } ]
  } ]
}

Best
Mike

Hi @mwiegand,

Would you change the “vh” unit to “mm” and check if you get your desired output?

Hi @armingrudd,

I tried almost every measure type there is like px, em, rem, vw/vh and, for print apparently, mm, cm. They seem the get ignored always when creating a PDF.

The only approach I found to mitigate it was to switch to portrait mode which results in the iframe width becoming the limiting factor. Though, that creates / wasted almost 50% of each sheet and causes difficulties reading the charts.

Best
Mike

Hi @armingrudd,

do you or does any colleague of yours have a recommendation or can share some best practices on how to generate proper PDF-Reports with properly sized and thus not cropped images?

Clients often like to have something printed out or archived for documentation purposes and I know from one rather large one who seems to have made the choice switching from Knime to Alteryx. Not stating this was the trigger but personally I feel that Knime lacks behind here compared to Tableau, Power BI & Co. when it comes to “export fidelity”.

Apologize in advance if I “overstep”, if I can do this et all, but maybe @DanielBog can share some advice like in the past :wink:

Thanks
Mike

Hey @mwiegand,

optimising for print is a hard problem and it heavily depends on your use case. For our views (except the Table View and Image View) this should work out nicely if you didn’t set hard coded width values in the layout editor. They will just spread equally (or spread according to your layout setup). As soon as it comes to the Table View or the Image View this gets way more complicated. For those two you can’t just scale them anymore, but you probably want to have fixed sizes. Therefore, you need to make sure that these are not larger than your page layout.

I agree that this is currently not easily possible, as you only see if it worked out after you created the actual report and we currently only allow px values as unit. We have a prototype running to allow various other units, which will improve this situation a bit. But the main problem is still that iterating to see if it worked out is still a slow progress. We have a few concepts in our minds to overcome this limitation, but most of them would require us to rewrite our current layout editor, which is something that is on our list for quiet some time already, but this is a larger undertaking, which will require lots of more thinking and time.

I hope this could give you a little insight.

Greetings,
Daniel

2 Likes

As always thanks for taking time providing comprehensive insights @DanielBog :slight_smile:

I started with default, not defining any additional styles, and now only define:

"additionalStyles" : [ "max-height: 200mm; max-width: 100%; margin-bottom: 1cm; padding: 1cm 1cm 2cm" ],

My approach is to only set boundaries but let the scaling happen dynamically. I also enforced page breaks after each chart and used portrait mode, resulting in lots of white space, but that way I ensured the graph is not exceeding the iframe wrapper.

Update
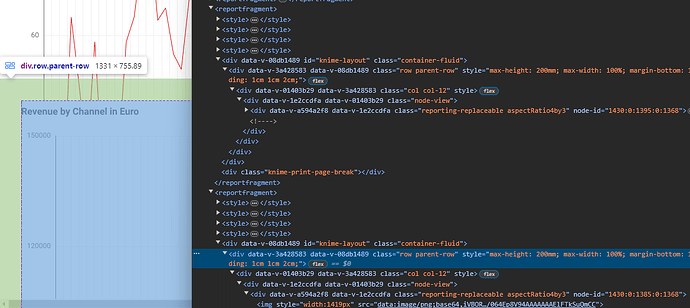
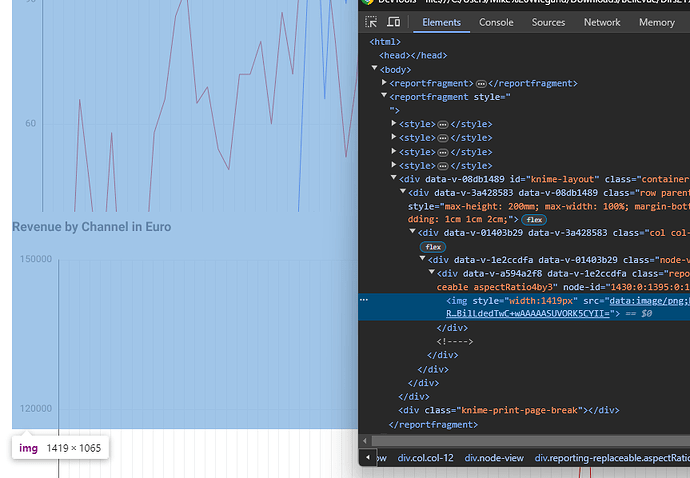
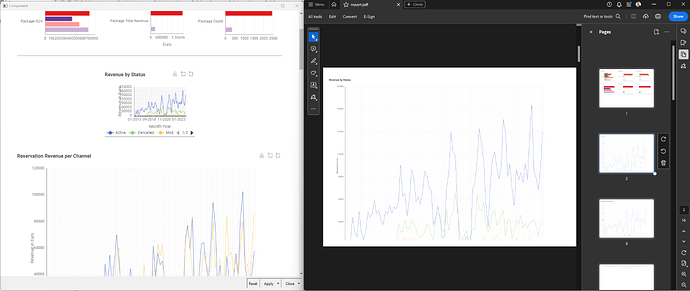
I managed to come closer finding the cause. Inspecting the output of the Consolidate Report node, which is basically HTML, that I saved as an html file I could inspect. I noticed there is no overlay hidden or so but the subsequent charts are simply overlapping the former.

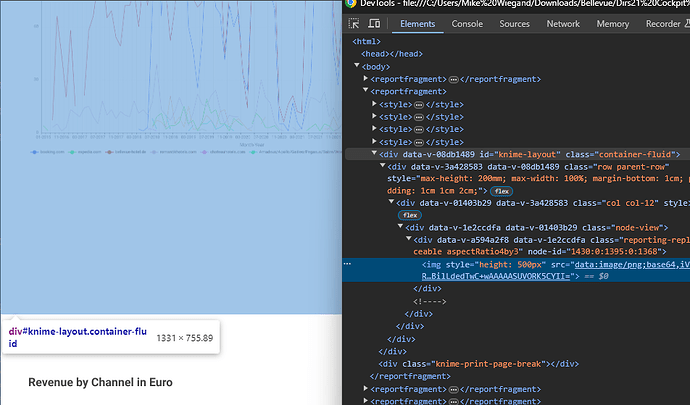
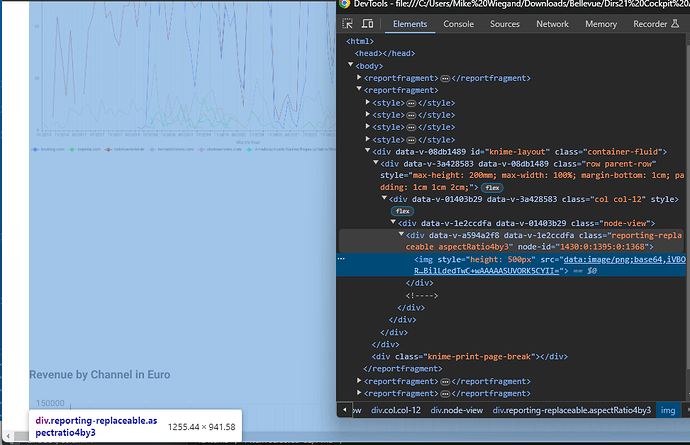
The images, inserted as data:image have a fixed width but no height. No clue where the height came from but it causes the data-image, which has no dimensions like a real image a browser could access, to scale accordingly and thus exceed the container.

Even by specifically reducing the height of the image to 500px the parent divs’ height exceeds the properly sized parent with the ID “knime-layout” and it’s child with the class “parent-row”.

I still try to wrap my head around the flex declarations in combination with the data-image.

About using fixed pixel I tried that as well. Assuming the PDF is generated at 96 ppi a height of 200mm equals around 755 px. That seems to not improve the issue either. The x-axis is still on the next page but there seems to be a outer container who’s size got reduced. That resulted in the subsequent chart being pulled onto the preceding page kind of ignoring the forced page break setting in the consolidate report node.

This is quite a lot of trail and error with no clear indication what can work. I am currently resorting to export images instead but really would like to leverage the interactivity for my clients.

Sorry if that is dragging on but i believe that part is crucial for the long term success of Knime. If reporting only works flawlessly on the server, the entry level is “absurdly” high. I will continue tomorrow trying to figure things out.

Best
Mike
Hey Mike,

thanks for having a closer look. Would it be possible for you to share that workflow?
I seem to be no able to reproduce the overlapping issue.

Sidenote: Reporting works the same on desktop AP and on the Hub/Server :wink:

Greetings,
Daniel

1 Like

Hi @armingrudd and @DanielBog,

I guess I figured things out. As a summary, the issues I face emerge primarily from these factors:

  1. Knime Processes: Wrapping graphs in components creates the type “nestedLayout”. Creating additional graphs within that lvl-1 component and wrapping these as a lvl-2 component has Knime creating a row of the type “view”. This is also true if I add a new row manually. The mixed types cause some confusion and, as a type of person who keeps things neatly ordered, I harmonized all to view.

  2. Documentation: “additionalStyles” are first mentioned in regards to the row element. Hence, I always added it there but did missed the table description of Table 9. Furthermore, the options for resizeMethod are missing explanation. Adding to this, Daniel mentioned that other size values than px are not supported but I noticed that cm or mm for margin an padding are supported. resizeMethod is, I believe, incorrectly documented as “Can be any of the following values”. The values " aspectRatio4by3 , aspectRatio16by9 , aspectRatio1by1 , manual" are not meant to work if the iframe-resizer library is used with the views-XYZ values. Using the iframe-resizer also requires absolute values like px being defined within the content-array of the type view. I.e. that additionalStyles can both be added in the array “rows” for each row but also in the array content withing columns alongside each type “view”. Certain options like “Offset Height” also require explanation and a note how that reflects when exported to PDFs. As a conclusion, a certain level of context is missing and eventually a visual representation of certain settings.

  3. Manual and repetitive Code Management: I have +40 graphs wrapped in components which are again grouped in another one. Managing all these, not being able to use centralize the definitions on a high level, using inheritance and local overwrites if necessary, increases chances of mistakes many fold.

I will spend some time in the near future creating an example workflow for testing but also for guidance. But first I got to sort my thoughts as this issues has so many facets that it brain is humming like a bee hive.

Cheers
Mike

1 Like