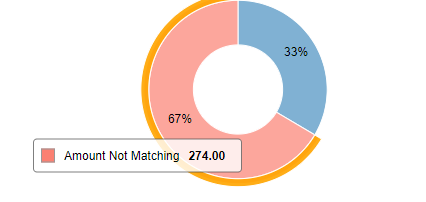
Hello, I am using Pie/Donut Chart(Java Script) to display the data, here the values are showing as Decimals instead of Number. Is there any possibility to change the configuration as Number.

Hello, I am using Pie/Donut Chart(Java Script) to display the data, here the values are showing as Decimals instead of Number. Is there any possibility to change the configuration as Number.

@VinayM ,
You can use the generic e-chart node to create a pie chart view. For your reference, I’ve attached the workflow and images.
TESTnew.knwf (74.4 KB)
Thank You @tqAkshay95 for your quick reply. I want to convert as image and download it in Excel, is it possible in this?
@VinayM ,
I will Try and get back to you
we have normal Pie Chart node for this but the thing is, it is working fine when we run the workflow in Knime Analytics Platform and getting error while run the same workflow in Knime web portal.
@VinayM ,
can you share the error?
Hey VinayM,
The Generic ECharts View is a viable solution, but I would rather recommend to use the native Pie Chart node (without JavaScript). This is the new native node we are moving forward with and can easily support. It should also not show the decimals ![]()
Greetings,
Daniel
This topic was automatically closed 90 days after the last reply. New replies are no longer allowed.