Pivot as in excel format

Hi everyone,
Is it possible to replicate the excel format pivot in knime? This is how my pivot should look like:


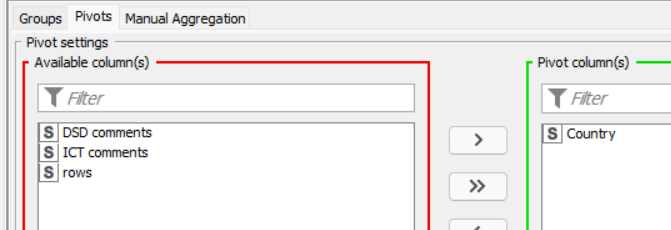
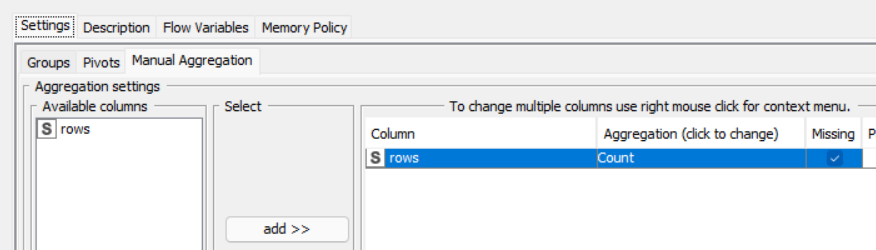
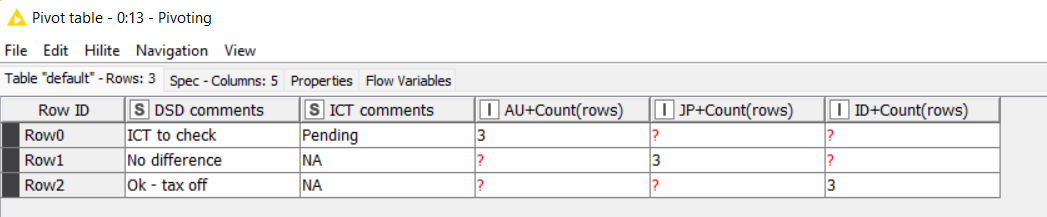
I tried using the pivoting node, but the limitation is that if I select the rows in GROUPS tab I cant have the same in manual aggregation. Is there any other way possible?
Attaching the excel sheet for reference as well.
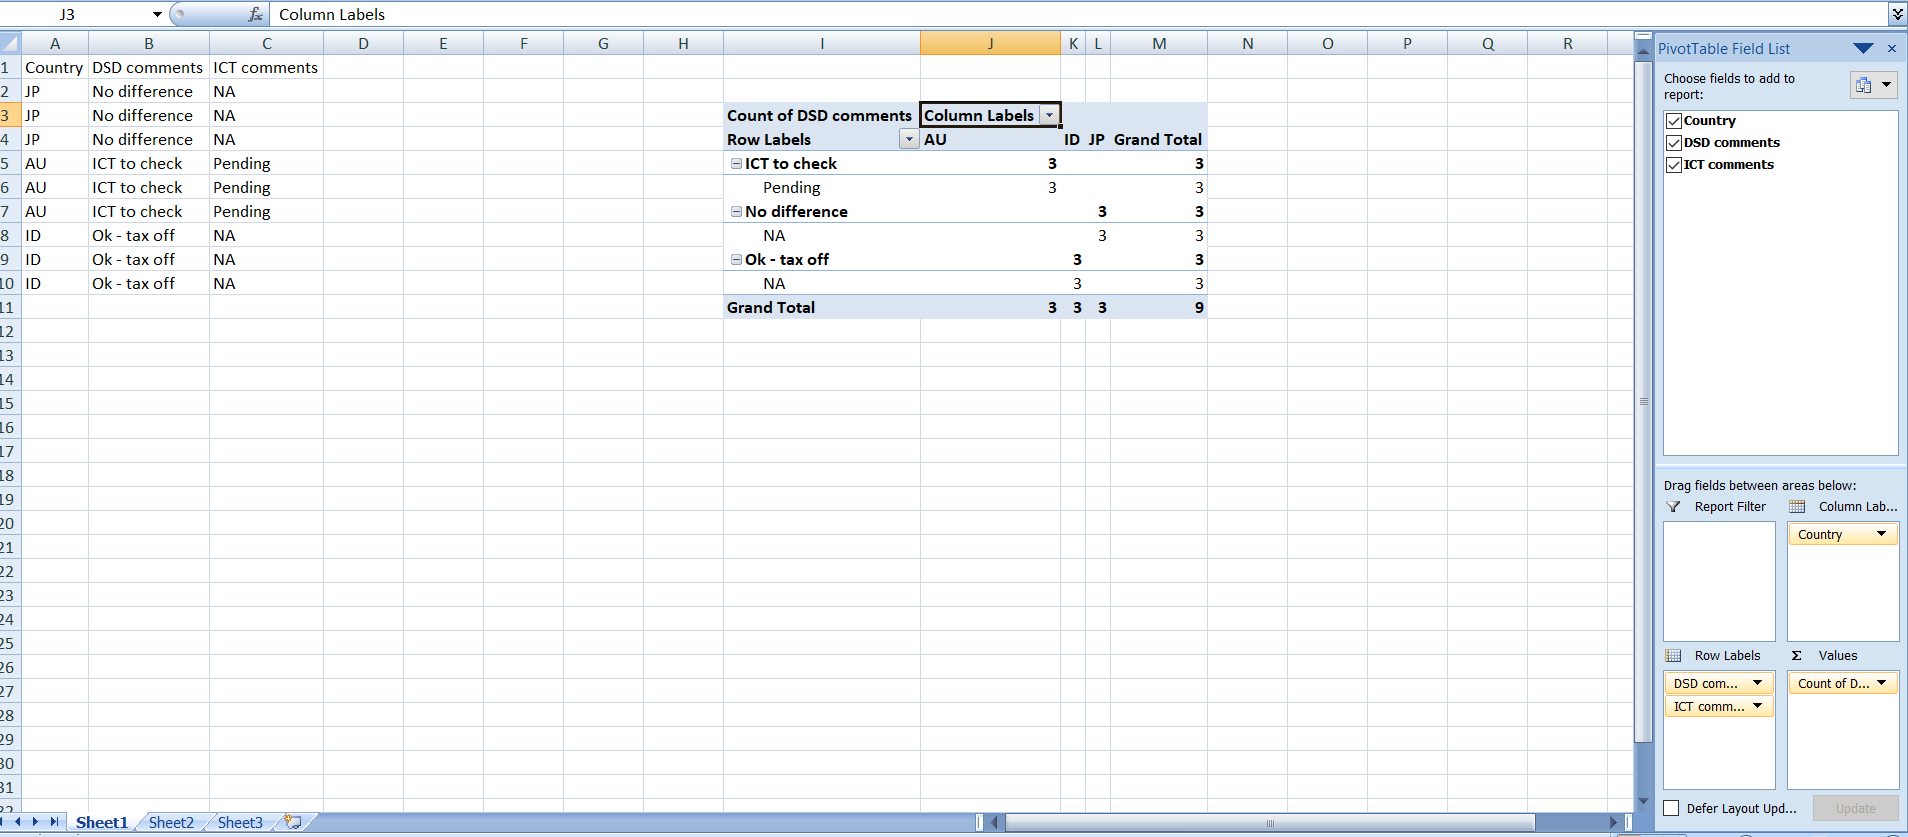
Thank you!
country pivot.xlsx (11.7 KB)

Hi @Saishiyam,

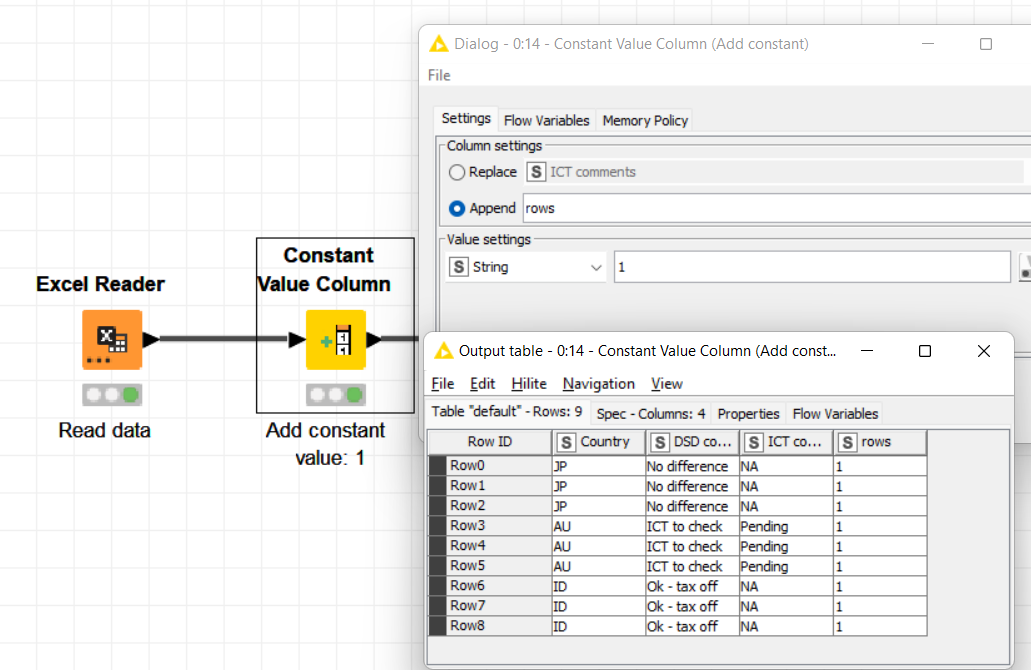
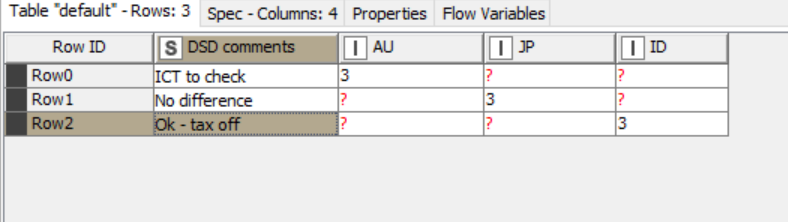
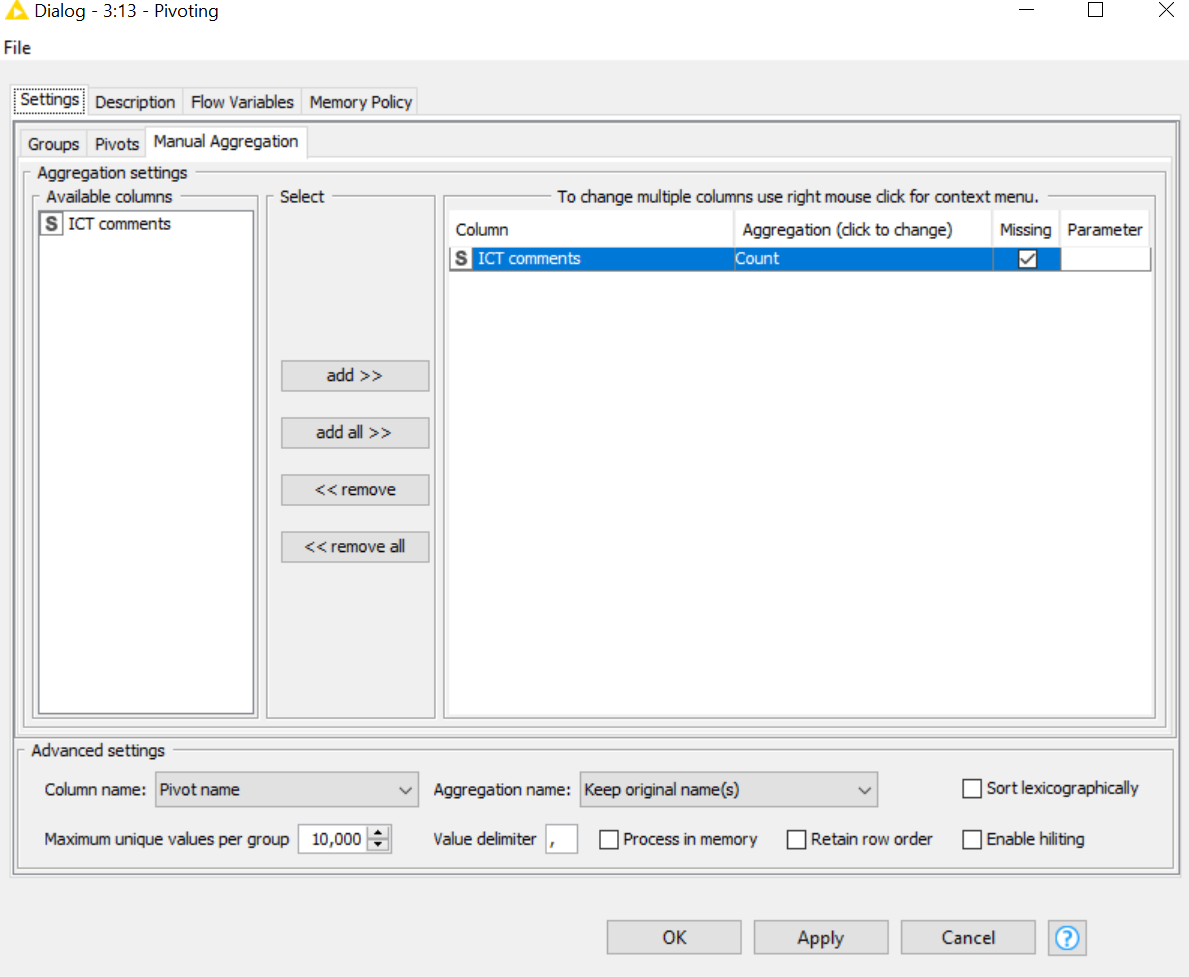
You don’t need grouping columns in aggregation column list. Since you are using “count”, you are able to use any other column. As long as you check “Missing”, there won’t be any difference in the output.

There are different ways to add a new column to your table, here is one of them:
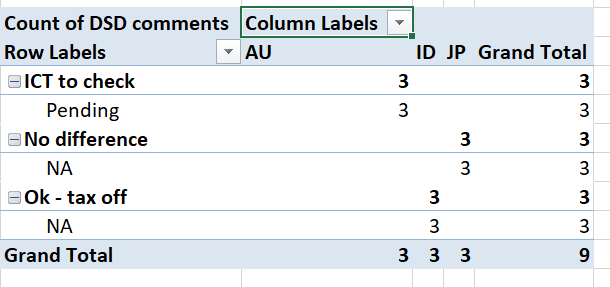
:blush:

Hi @Saishiyam,

What @armingrudd suggests is that build your pivot table like this:

The first step is to read and add a constant column

Then, use that new column to count the number of records per combination/groups of DSD and ICT:

Pivot by country:
image

And aggregate by counting rows:

Final result:

Let us know how it goes.

2 Likes

Hi @armingrudd

Thank you for your reply! I get the result in this format:


I need it in a way like this where it shows both the comments:
image
Is there anything else that I have to be changing here?

Thanks!

oops, just saw @eamendola 's comment. Trying it out

1 Like

Hi @armingrudd @eamendola The mentioned solution is fine for now, but is it possible to replicate the exact same excel format? like with expanded rows one below the other as in the screenshot
image

Hi @Saishiyam,

I don’t think that’s possible since the output tables are static, so KNIME doesn’t have that functionality.

Maybe you can prepare your data in KNIME and then write it to an excel file where you can play around with pivot tables and formatting.

Cheers.

This topic was automatically closed 90 days after the last reply. New replies are no longer allowed.