Hello everybody. I have a table with 4 stocks, and i want to plot all from the same point for comparing the trend between them. I read that i must to divide all the rows by the firts row to compare all the time series in the plot. Anyone can help me?.Thanks a lot! Best!!
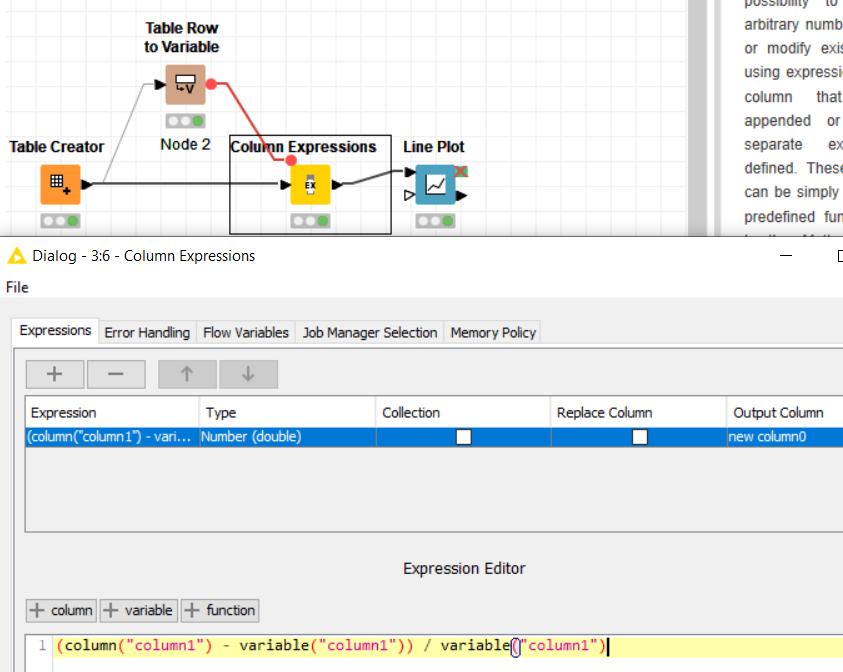
How do you want to compare them? If plotting absolute values is sufficient you can just go ahead and plot the table as is in a line plot, using date for x axis information and the stock columns to plot individual lines. If you want to “normalize” the data with respect to relative growth since start of measuring, you can compute the differences between the all the values and the start value divided by the start value, e.g. like this:
2 Likes
Great!! it works great!. one question to understand the process, in this case the "variable (column1) takes only the firts row of the column, right?
It is not very clear to me what is the difference between column 1 and column 1 variable. Thanks a lot for your answer and help!!
Martin Pratto
Exactly, table row to variable will create a set of flow variables for all values available from the very first row of the input table. The expression you see on the screenshot will be applied row-wise for every row, so column(“column1”) refers to the value of a specific row of the specified column. And yes, I should have used more descriptive column and flow variable names in my example. 
1 Like
This topic was automatically closed 182 days after the last reply. New replies are no longer allowed.